Time Series Analysis
import pandas as pd
import numpy as np
import seaborn as sns
import matplotlib.pyplot as plt
from scipy import signal
import math
import statsmodels.api as sm
from scipy import stats
from statsmodels.tsa.arima_model import ARIMA
from statsmodels.tsa.arima_model import ARMA
import datetime
from sklearn.metrics import mean_squared_error
import matplotlib.mlab as mlab
import math
from scipy.stats import norm
import statsmodels.graphics.tsaplots as tsa
from pandas.plotting import register_matplotlib_converters
register_matplotlib_converters()
%config InlineBackend.figure_format = 'retina'
Données “Syndromes grippaux”
1) Importez les données du fichier Openhealth_S-Grippal.csv. Consultez http://www.openhealth. fr/ias pour plus d’information sur les données. Affichez les 5 premières lignes du jeu de données. On va travailler seulement avec la variable IAS_brut, sous la forme d’une série temporelle, dont on précisera la fréquence d’échantillonage et les dates de début et de fin. Pour cette variable, dans ce jeu de données, les cas de nullité correspondent à des données manquantes. Combiende données manquantes comporte-t-elle? Pour les traitements des questions suivantes, éliminez les données manquantes par imputation, c’est-à-dire en déduisant une valeur plus “raisonnable” aux dates non- observées à partir des valeurs aux dates observées : par exemple par la moyenne de deux dates les plus proches.
df = pd.read_csv("OpenhealthS-Grippal.csv", delimiter=";",
                 encoding="latin-1", decimal=",", na_values=0)
df.tail()
| PERIODE | IAS_brut | IAS_lisse | Incidence_Sentinelles | |
|---|---|---|---|---|
| 1747 | 2014-04-13 | 77.9 | 1.8 | NaN |
| 1748 | 2014-04-14 | 2.7 | 1.7 | NaN |
| 1749 | 2014-04-15 | 1.0 | 1.6 | NaN |
| 1750 | 2014-04-16 | 1.6 | 1.6 | NaN |
| 1751 | 2014-04-17 | 0.4 | 1.6 | NaN |
df.describe()
| IAS_brut | IAS_lisse | Incidence_Sentinelles | |
|---|---|---|---|
| count | 1744.000000 | 1752.000000 | 1734.000000 |
| mean | 316.680046 | 34.805023 | 13.536332 |
| std | 2752.169290 | 101.589259 | 22.547233 |
| min | 0.100000 | 0.300000 | 0.100000 |
| 25% | 1.300000 | 1.200000 | 1.100000 |
| 50% | 3.800000 | 2.850000 | 3.600000 |
| 75% | 23.275000 | 11.400000 | 13.350000 |
| max | 71851.800000 | 863.100000 | 110.000000 |
df['IAS_brut'].isnull().sum()
8
Il y a 8 valeurs manquantes.
#On choisi l'interpolation linéaire  pour les valeurs manquantes.
df['IAS_brut'] = df['IAS_brut'].interpolate(method='linear',axis=0)
- Tracez la série temporelle considérée en fonction du temps. Commentez brièvement ce que vous observez.
#transform to datastamps
df['PERIODE'] = pd.to_datetime(df['PERIODE'])
type(df['PERIODE'])
pandas.core.series.Series
sns.set()
plt.figure(figsize=(15, 5))
plt.plot(df['PERIODE'].values, df['IAS_brut'].values)
plt.title("Série temporel - IAS Brut (2009-2014)")
plt.show()

Il y a une périodité annuelle(sans doute lié avec le pic d’épidemie de la grippe en hiver). Cependant, le pic est moins prononcée pour 2014.
- Tracez l’histogramme de la loi marginale. Quel impact la distribution observée par l’histogramme a sur la trajectoire représentée à la question précédente ?
sns.set()
plt.figure(figsize=(15, 8))
plt.subplot(2, 1, 1)
plt.hist(df['IAS_brut'], bins=400)
plt.xlabel('IAS Brut')
plt.ylabel('Frequence')
plt.title("Histogramme de IAS Brut")
Text(0.5, 1.0, 'Histogramme de IAS Brut')

Les pics avec grandes valeurs IAS sont de fréquences très faibles. Les valeurs de IAS sont plus souvent proches de 0.
- Reprenez les questions précédentes après tranformations des observations par le logarithme naturel. Commentez.
sns.set()
plt.figure(figsize=(15, 5))
# numpy.log is the natural logarithme
plt.plot(np.log(df['IAS_brut']))
plt.title("Série temporel - log(IAS Brut) - (2009-2014) ")
plt.show()

sns.set()
plt.figure(figsize=(15, 5))
plt.hist(np.log(df['IAS_brut']), bins=100)
plt.title("Histogramme de l'IAS Logarithmisé")
plt.xlabel('IAS logarithmisé(népérien)')
plt.ylabel('Frequence')
plt.show()
# log(IAS Brut)<0 quand IAS Brut <1

Un axe logarithmique comprime l’échelle de manière non linéaire,les grands valeurs de IAS sont comprimés, rapprochés de 1, en revanche les valeurs inférieurs à 1 sont dilatés et renvoyés vers l’infini négatif.
Cela signifie que des bacs de largeur variable doivent être utilisés pour les histogrammes. Ici on utilise toujours des bacs de largeur fix, ce qui permets de raprocher la ‘longue queue à droite’ vers 1 afin de mieux visualiser.
- En utilisant signal.perodogram() (du package signal importé depuis scipy), tracez le périodo- gramme des données. Expliquez les pics les plus significatifs que vous observez. Attention au fait que dans la communauté signal les spectres sont normalisées pour des fréquences absolues dans [−1/2, 1/2] plutôt que [−π, −π].
sns.set()
plt.figure(figsize=(15, 10))
plt.subplot(2, 1, 1)
# f : ndarray : Array of sample frequencies.
# Pxx : ndarray :Power spectral density or power spectrum of x.
f, Pxx_den = signal.periodogram(np.log(df['IAS_brut']), scaling='density')
plt.plot(f, Pxx_den)
# plt.xlabel('frequency')
plt.axvline(x=1/7, c='y', linestyle=':')
plt.axvline(x=1/3.5, c='y', linestyle=':')
plt.axvline(x=3/7, c='y', linestyle=':')
plt.axvline(x=1/365, c='y', linestyle=':')
plt.text(1/250, 1500, 'f=1/365')
plt.text(1/6.6, 1500, 'f=1/7')
plt.ylabel('power spectral density (PSD) , scaling=density')
plt.title('Periodogram with raw IAS data and logarithmized IAS data')

plt.subplot(2, 1, 2)
f, Pxx_den = signal.periodogram(np.log(df['IAS_brut']), scaling='density')
plt.plot(f, Pxx_den)
# This is just a thin wrapper around plot which additionally changes the y-axis to log scaling.
plt.semilogy(f, Pxx_den)
# https://matplotlib.org/3.1.1/api/_as_gen/matplotlib.pyplot.semilogy.html
plt.ylim(10e-5,)
plt.axvline(x=1/7, c='y', linestyle=':')
plt.axvline(x=1/3.5, c='y', linestyle=':')
plt.axvline(x=3/7, c='y', linestyle=':')
plt.axvline(x=1/365, c='y', linestyle=':')
plt.text(1/250, 1500, 'f=1/365')
plt.text(1/6.6, 1500, 'f=1/7')
plt.xlabel('frequency [1/n_jour]')
plt.ylabel('power spectral density (PSD) ')
plt.show()

Le périodogramme est une estimation de la densité spectrale d’un signal. Les pics sur le périodogramme montres les fréquences les plus importantes/dense. Cela corresponds avec les périodicités/saisonnalités les plus significatives.
# show the first peak
sns.set()
plt.figure(figsize=(15, 4))
f, Pxx_den = signal.periodogram(np.log(df['IAS_brut']), scaling='density')
plt.plot(f, Pxx_den)
plt.axvline(x=1/350, c='r', linestyle=':')
plt.xlim([1/1000, 1/40])
plt.text(1/250, 1500, 'f=1/365')

plt.xlabel('frequency [Hz]')
plt.ylabel('Linear spectrum [V RMS]')
plt.show()

Le permier pic corresponds à la fréquence de 1/365.
- Pour supprimer une tendance périodique de période T dans un signal (xt)t∈Z il suffit d’appliquer le filtre ∆T défini par [∆T x]t = xt − xt−T Utilisez cette méthode pour supprimer la tendance périodique de période 1 an. Quel pic du périodogramme cette méthode a fait disparaître ?
# On supprime l'autocorrélation annuelle
time_diff = []
for i in range(365, len(df)):
    time_diff.append(np.log(df.loc[i]['IAS_brut']) -
                     np.log(df.loc[i-365]['IAS_brut']))

sns.set()
plt.figure(figsize=(15, 5))
plt.plot(time_diff)
plt.text(1/250, 5, 'f=1/365')
plt.title(
    "Logarithmized IAS data with annual periodicity eliminated : serie X(t)-X(t-365) :")
plt.show()

# periodogram with previous data
sns.set()
plt.figure(figsize=(15, 10))
plt.subplot(2, 1, 1)
f, Pxx_den = signal.periodogram(time_diff)
plt.plot(f, Pxx_den)
plt.axvline(x=1/7, c='y', linestyle=':')
plt.axvline(x=1/3.5, c='y', linestyle=':')
plt.axvline(x=3/7, c='y', linestyle=':')
plt.axvline(x=1/365, c='y', linestyle=':')
plt.ylim(10e-5,)
plt.text(1/250, 600, 'f=1/365')
plt.text(1/6.6, 600, 'f=1/7')
plt.xlabel('frequency [1/n_jour]')
plt.ylabel('PSD ')

plt.subplot(2, 1, 2)
plt.semilogy(f, Pxx_den)
plt.axvline(x=1/7, c='y', linestyle=':')
plt.axvline(x=1/3.5, c='y', linestyle=':')
plt.axvline(x=3/7, c='y', linestyle=':')
plt.axvline(x=1/365, c='y', linestyle=':')
plt.ylim(10e-5,)
plt.text(1/250, 600, 'f=1/365')
plt.text(1/6.6, 600, 'f=1/7')
plt.xlabel('frequency [1/n_jour]')
plt.ylabel('PSD ')
plt.show()

Cette méthode a fait disparaitre le pic du périodogramme sur 1/365. Le plus grand pic maintenant corresponds aux Fréquence 1/3.5, 3/7,1/7.
- On vous propose un exercise de prédiction uniquement à partir de la tendance périodique. On va prédire les valeurs de IAS_brut pour les dates du 1er avril 2013 au 17 avril 2014 en se basant sur les observations précédentes (du 1er juillet 2009 au 31 mars 2013) pour estimer la tendance périodique des données. Pour cela, pour un nombre d’harmoniques fixé (disons n_harm), construisez les variables explicatives pour la période d’apprentissage : pour chaque k = 1, 2, … n_harm, ajoutez deux variables explicatives, xi,2k−1 = cos(ti · k · 2π ) et xi,2k = sin(ti · k · 2π ), où ti est le moment TT de temps (on peut utiliser les nombres entiers au lieu de dates) et T = 365. Estimez la tendance périodique en régressant les données d’apprentissage sur ces variables explicatives.
Avec ce modèle linéaire, prédisez les valeurs du variable IAS_brut pour la période du 1er avril 2013 au 17 avril 2014. Tracez les valeur de la série temporelle et votre prédiction pour l’ensemble de données (vous pouvez utilisez les couleurs différentes pour pour les partie apprentissage et prédiction). Puis, donnez le risque quadratique de la prédiction et tracez les résidus pour la période prédite. Essayez les valeur de n_harm pour voir comment varie le risque quadratique de la prédiction.
# We will try with raw IAS data and logarithmized IAS data
X = df.copy()
X = X.drop(['IAS_lisse', 'Incidence_Sentinelles'], axis=1)
X['IAS_log'] = np.log(X['IAS_brut'])
X['index'] = X.index
X.head()
| PERIODE | IAS_brut | IAS_log | index | |
|---|---|---|---|---|
| 0 | 2009-07-01 | 1.7 | 0.530628 | 0 |
| 1 | 2009-07-02 | 3.4 | 1.223775 | 1 |
| 2 | 2009-07-03 | 2.1 | 0.741937 | 2 |
| 3 | 2009-07-04 | 1.3 | 0.262364 | 3 |
| 4 | 2009-07-05 | 14.2 | 2.653242 | 4 |
# try a number of harmonics
n_harm = 5

# make 2*n_harm features
for k in range(1, 2*n_harm, 2):
    X['cos' + str(k)] = np.cos(X['index'] * (k * 2 * math.pi / 365))
    k += 1
    X['sin' + str(k)] = np.sin(X['index'] * (k * 2 * math.pi / 365))
# features: 2n harmonics ,  label1: IAS_brut , label2:IAS_log
X.head()
| PERIODE | IAS_brut | IAS_log | index | cos1 | sin2 | cos3 | sin4 | cos5 | sin6 | cos7 | sin8 | cos9 | sin10 | |
|---|---|---|---|---|---|---|---|---|---|---|---|---|---|---|
| 0 | 2009-07-01 | 1.7 | 0.530628 | 0 | 1.000000 | 0.000000 | 1.000000 | 0.000000 | 1.000000 | 0.000000 | 1.000000 | 0.000000 | 1.000000 | 0.000000 |
| 1 | 2009-07-02 | 3.4 | 1.223775 | 1 | 0.999852 | 0.034422 | 0.998667 | 0.068802 | 0.996298 | 0.103102 | 0.992749 | 0.137279 | 0.988023 | 0.171293 |
| 2 | 2009-07-03 | 2.1 | 0.741937 | 2 | 0.999407 | 0.068802 | 0.994671 | 0.137279 | 0.985220 | 0.205104 | 0.971100 | 0.271958 | 0.952378 | 0.337523 |
| 3 | 2009-07-04 | 1.3 | 0.262364 | 3 | 0.998667 | 0.103102 | 0.988023 | 0.205104 | 0.966848 | 0.304921 | 0.935368 | 0.401488 | 0.893919 | 0.493776 |
| 4 | 2009-07-05 | 14.2 | 2.653242 | 4 | 0.997630 | 0.137279 | 0.978740 | 0.271958 | 0.941317 | 0.401488 | 0.886071 | 0.523416 | 0.814046 | 0.635432 |
#  just show some harmonics
sns.set()
plt.figure(figsize=(15, 4))
plt.plot(X['cos1'])
plt.plot(X['sin2'])
plt.plot(X['cos3'], alpha=0.3)
plt.plot(X['cos5'], alpha=0.3)
[<matplotlib.lines.Line2D at 0x1c173ec908>]

#chose training data (time periode) and test data
X_train = X[X['PERIODE'] <= "2013-03-31"]
X_test = X[X['PERIODE'] > "2013-03-31"]
y_train = X_train['IAS_brut']
X_train = X_train.drop(['IAS_brut', 'IAS_log','PERIODE'], axis=1)

y_test = X_test['IAS_brut']
X_test = X_test.drop(['PERIODE', 'IAS_log','IAS_brut'], axis = 1)
X_train.head()
| index | cos1 | sin2 | cos3 | sin4 | cos5 | sin6 | cos7 | sin8 | cos9 | sin10 | |
|---|---|---|---|---|---|---|---|---|---|---|---|
| 0 | 0 | 1.000000 | 0.000000 | 1.000000 | 0.000000 | 1.000000 | 0.000000 | 1.000000 | 0.000000 | 1.000000 | 0.000000 |
| 1 | 1 | 0.999852 | 0.034422 | 0.998667 | 0.068802 | 0.996298 | 0.103102 | 0.992749 | 0.137279 | 0.988023 | 0.171293 |
| 2 | 2 | 0.999407 | 0.068802 | 0.994671 | 0.137279 | 0.985220 | 0.205104 | 0.971100 | 0.271958 | 0.952378 | 0.337523 |
| 3 | 3 | 0.998667 | 0.103102 | 0.988023 | 0.205104 | 0.966848 | 0.304921 | 0.935368 | 0.401488 | 0.893919 | 0.493776 |
| 4 | 4 | 0.997630 | 0.137279 | 0.978740 | 0.271958 | 0.941317 | 0.401488 | 0.886071 | 0.523416 | 0.814046 | 0.635432 |
Estimez la tendance périodique en régressant les données d’apprentissage sur ces variables explicatives.
X_train_pred = X_train.copy()
X_train_pred.head()
| index | cos1 | sin2 | cos3 | sin4 | cos5 | sin6 | cos7 | sin8 | cos9 | sin10 | |
|---|---|---|---|---|---|---|---|---|---|---|---|
| 0 | 0 | 1.000000 | 0.000000 | 1.000000 | 0.000000 | 1.000000 | 0.000000 | 1.000000 | 0.000000 | 1.000000 | 0.000000 |
| 1 | 1 | 0.999852 | 0.034422 | 0.998667 | 0.068802 | 0.996298 | 0.103102 | 0.992749 | 0.137279 | 0.988023 | 0.171293 |
| 2 | 2 | 0.999407 | 0.068802 | 0.994671 | 0.137279 | 0.985220 | 0.205104 | 0.971100 | 0.271958 | 0.952378 | 0.337523 |
| 3 | 3 | 0.998667 | 0.103102 | 0.988023 | 0.205104 | 0.966848 | 0.304921 | 0.935368 | 0.401488 | 0.893919 | 0.493776 |
| 4 | 4 | 0.997630 | 0.137279 | 0.978740 | 0.271958 | 0.941317 | 0.401488 | 0.886071 | 0.523416 | 0.814046 | 0.635432 |
# use linear regression
# the features are harmonics , label is IAS data
from sklearn.linear_model import LinearRegression

reg = LinearRegression().fit(X_train, y_train)
pred = reg.predict(X_test)
X_train_fit = reg.predict(X_train)

print('The weights of intercept and the features(harmonics):')
print(reg.coef_)
The weights of intercept and the features(harmonics):
[ 2.97597104e-01 -5.48213297e+02  3.80046791e+02  9.45722945e+01
  5.50231412e+01  1.03784280e+02 -1.61630047e+02 -2.95835718e+02
  1.16577290e+02 -1.17099138e+02  7.46308105e+01]
# Calculate the fitting curve on training data
X_train_pred = X_train.copy()
X_train_pred = X_train_pred.drop(['index'], axis=1)
X_train_pred.insert(loc=0, column='intercept', value=reg.intercept_)
for i in range(len(reg.coef_)):
    # print(X_train_pred.iloc[0,i],reg.coef_[i])
    X_train_pred.iloc[:, i] = X_train_pred.iloc[:, i]*reg.coef_[i]
X_train_pred.insert(loc=len(reg.coef_), column='pred', value=0)

for i in range(len(reg.coef_)):
    # print(i,X_train_pred.iloc[0,i])
    X_train_pred['pred'] = X_train_pred['pred']+X_train_pred.iloc[:, i]

# show the first Harmonics(features) with weights
sns.set()
plt.figure(figsize=(16, 6))
plt.plot(X_train_pred['cos1'], label='harmonic with annual periocity')
plt.plot(X_train_pred['sin2'], label='harmonic p=365/2', alpha=0.6)
plt.plot(X_train_pred['cos3'], alpha=0.3)
plt.plot(X_train_pred['sin4'], alpha=0.3)
# plt.plot(X_train_pred['cos5'],alpha=0.3)
# plt.plot(X_train_pred['sin6'],alpha=0.3)
plt.ylabel('IAS_brut')
plt.plot(X_train_pred['pred'], label='global fitting curve', color='r')
plt.legend()
<matplotlib.legend.Legend at 0x1c18aaaeb8>

Le plus grand poids (-5.48213297e+02) est sur l’harmonique blue cos(2*pi/365) : périodicité annuelle. C’est l’harmonique la plus importante, cela corrésponds tout à fait avec la question 5 et l’analyse sur la périodogram.
Avec ce modèle linéaire, prédisez les valeurs du variable IAS_brut pour la période du 1er avril 2013 au 17 avril 2014.
# show the sum of all weighted variables
# compare with the real historic data
sns.set()
plt.figure(figsize=(15, 5))
#plt.plot(X_train['index'],X_train_pred['pred'],label='fit on train data')
plt.plot(X_train['index'], X_train_fit)
plt.plot(X_train['index'], y_train)
plt.plot(X_test['index'], pred, label='prediction')
plt.plot(X_test['index'], y_test, label='test')
plt.legend()
plt.show()

Donnez le risque quadratique de la prédiction et tracez les résidus pour la période prédite. Essayez les valeur de n_harm pour voir comment varie le risque quadratique de la prédiction.
residus_brut = pred - y_test
quad_risk = sum((y_test - pred)**2)
quad_risk
plt.figure(figsize=(16, 4))
plt.plot(residus_brut, label='résidus with raw IAS data')
plt.ylabel('résidus')
plt.legend()
<matplotlib.legend.Legend at 0x1c1ae73208>

Avec 10 harmoniques(features), le modèle prédicte assez bien.
# with large n_harm, the model will overfit
n_harm = 500

X = df.copy()
X = X.drop(['IAS_lisse', 'Incidence_Sentinelles'], axis=1)
X['IAS_log'] = np.log(X['IAS_brut'])
X['index'] = X.index

for k in range(1, 2*n_harm, 2):
    X['cos' + str(k)] = np.cos(X['index'] * (k * 2 * math.pi / 365))
    k += 1
    X['sin' + str(k)] = np.sin(X['index'] * (k * 2 * math.pi / 365))

X_train = X[X['PERIODE'] <= "2013-03-31"]
X_test = X[X['PERIODE'] > "2013-03-31"]

y_train = X_train['IAS_brut']
X_train = X_train.drop(['IAS_brut', 'IAS_log', 'PERIODE'], axis=1)
y_test = X_test['IAS_brut']
X_test = X_test.drop(['PERIODE', 'IAS_log', 'IAS_brut'], axis=1)

# Linear Regression
reg = LinearRegression().fit(X_train, y_train)
reg.score(X_train, y_train)
pred = reg.predict(X_test)
X_train_fit = reg.predict(X_train)

sns.set()
plt.figure(figsize=(16, 6))
plt.plot(y_train, label="TrainingData")
plt.plot(X_train['index'], X_train_fit, alpha=0.5, label="Fit on TrainingData")
plt.plot(X_test['index'], pred, label="Prediction", alpha=0.5)
plt.plot(X_test['index'], y_test)  # label="TestData"
plt.legend()
plt.show()

Avec large nombre de harmoniques(features), 500 par example, le modèle rencontre le problème de ‘overfitting’/surapprendissage. Le risque empirique dimimue alors que le risque de généralisation augemente. Ce problème est particulièrement grave ici puisque il y a des valeurs extremes.
# Test with logarithmized data

n_harm = 500
X = df.copy()
X = X.drop(['IAS_lisse', 'Incidence_Sentinelles'], axis=1)
X['IAS_log'] = np.log(X['IAS_brut'])
X['index'] = X.index

for k in range(1, 2*n_harm, 2):
    X['cos' + str(k)] = np.cos(X['index'] * (k * 2 * math.pi / 365))
    k += 1
    X['sin' + str(k)] = np.sin(X['index'] * (k * 2 * math.pi / 365))

X_train = X[X['PERIODE'] <= "2013-03-31"]
X_test = X[X['PERIODE'] > "2013-03-31"]

y_train = X_train['IAS_log']
X_train = X_train.drop(['IAS_brut', 'IAS_log', 'PERIODE'], axis=1)

y_test = X_test['IAS_log']
X_test = X_test.drop(['PERIODE', 'IAS_log', 'IAS_brut'], axis=1)

# Linear Regression
reg = LinearRegression().fit(X_train, y_train)
reg.score(X_train, y_train)
# reg.coef_
# reg.intercept_
pred = reg.predict(X_test)
X_train_fit = reg.predict(X_train)

plt.figure(figsize=(16, 6))
plt.plot(X_train['index'], y_train, label="TrainingData")
plt.plot(X_train['index'], X_train_fit, alpha=0.5, label="Fit on TrainingData")
plt.plot(X_test['index'], pred, label="Prediction", alpha=0.5)
plt.plot(X_test['index'], y_test)  # label="TestData"
plt.legend()
plt.show()

Un essaie avec données logarithmisés. On obtient moins de surapprendissage.
# make a loop to calculate the Square Error with different n_harmonique
residus_brut = []
residus_log = []
quad_risk_brut = []
quad_risk_log = []
n_harmonique = []
for n_harm in range(1, 100, 3):
    n_harmonique.append(n_harm)
    X = df.copy()
    X = X.drop(['IAS_lisse', 'Incidence_Sentinelles'], axis=1)
    X['IAS_log'] = np.log(X['IAS_brut'])
    X['index'] = X.index

    for k in range(1, 2*n_harm, 2):
        X['cos' + str(k)] = np.cos(X['index'] * (k * 2 * math.pi / 365))
        k += 1
        X['sin' + str(k)] = np.sin(X['index'] * (k * 2 * math.pi / 365))

    # use raw IAS data and logarithmized IAS data
    X_train = X[X['PERIODE'] <= "2013-03-31"]
    X_test = X[X['PERIODE'] > "2013-03-31"]
    y_train_brut = X_train['IAS_brut']
    y_train_log = X_train['IAS_log']
    X_train = X_train.drop(['IAS_brut', 'PERIODE', 'IAS_log'], axis=1)
    y_test_brut = X_test['IAS_brut']
    y_test_log = X_test['IAS_log']
    X_test = X_test.drop(['PERIODE', 'IAS_brut', 'IAS_log'], axis=1)

    reg_brut = LinearRegression().fit(X_train, y_train_brut)
    reg_log = LinearRegression().fit(X_train, y_train_log)
    #reg.score(X_train, y_train)

    reg.coef_

    reg.intercept_

    pred_brut = reg_brut.predict(X_test)
    pred_log = reg_log.predict(X_test)
    quad_risk_brut.append(sum((y_test_brut - pred_brut)**2))
    quad_risk_log.append(sum((y_test_log - pred_log)**2))
plt.figure(figsize=(16, 8))
plt.subplot(2, 1, 1)
plt.plot(n_harmonique, quad_risk_brut, label='quad_risk with raw IAS data')
plt.ylabel('quad_risk')
plt.legend()
plt.subplot(2, 1, 2)
plt.plot(n_harmonique, quad_risk_log,
         label='quad_risk with logarithmized IAS data')
plt.xlabel('n_harmonique')
plt.ylabel('quad_risk')
plt.legend()
plt.show()

Plus le nombre d’harmoniques est élevé, plus le modèle est complexe avec risque de surapprendissage. Le risque quadratique est optimal avec le nombre d’harmonique très petit. C’est aussi par ce que le 1er harmonique est déjà sur une périocité annuelle.
#use statmodel O function
est = sm.OLS(y_train, X_train).fit()
print(est.summary())
OLS Regression Results
=======================================================================================
Dep. Variable: IAS_log R-squared (uncentered): 0.574
Model: OLS Adj. R-squared (uncentered): 0.503
Method: Least Squares F-statistic: 8.109
Date: Sun, 26 Jan 2020 Prob (F-statistic): 5.57e-122
Time: 21:57:37 Log-Likelihood: -2910.0
No. Observations: 1370 AIC: 6210.
Df Residuals: 1175 BIC: 7228.
Df Model: 195
Covariance Type: nonrobust
==============================================================================
coef std err t P>|t| [0.025 0.975]
------------------------------------------------------------------------------
index 0.0021 7.54e-05 27.517 0.000 0.002 0.002
cos1 -1.9675 0.084 -23.358 0.000 -2.133 -1.802
sin2 0.5039 0.084 6.007 0.000 0.339 0.668
cos3 0.1163 0.084 1.389 0.165 -0.048 0.281
sin4 0.0352 0.084 0.420 0.674 -0.129 0.200
cos5 0.1043 0.084 1.246 0.213 -0.060 0.269
sin6 0.0150 0.084 0.179 0.858 -0.149 0.179
cos7 -0.1951 0.084 -2.330 0.020 -0.359 -0.031
sin8 0.0154 0.084 0.183 0.855 -0.149 0.180
cos9 0.0064 0.084 0.077 0.939 -0.158 0.171
sin10 0.0411 0.084 0.491 0.624 -0.123 0.205
cos11 -0.1512 0.084 -1.806 0.071 -0.315 0.013
sin12 0.0103 0.084 0.124 0.902 -0.154 0.175
cos13 -0.0868 0.084 -1.037 0.300 -0.251 0.077
sin14 0.0448 0.084 0.535 0.593 -0.120 0.209
cos15 -0.0681 0.084 -0.814 0.416 -0.232 0.096
sin16 0.0209 0.084 0.249 0.803 -0.143 0.185
cos17 -0.0405 0.084 -0.484 0.629 -0.205 0.124
sin18 -0.0115 0.084 -0.137 0.891 -0.176 0.153
cos19 -0.0919 0.084 -1.098 0.273 -0.256 0.072
sin20 -0.0029 0.084 -0.035 0.972 -0.167 0.161
cos21 -0.0614 0.084 -0.734 0.463 -0.226 0.103
sin22 -0.0113 0.084 -0.135 0.892 -0.176 0.153
cos23 -0.0348 0.084 -0.416 0.678 -0.199 0.129
sin24 0.0282 0.084 0.337 0.736 -0.136 0.193
cos25 0.0166 0.084 0.198 0.843 -0.148 0.181
sin26 -0.0242 0.084 -0.288 0.773 -0.188 0.140
cos27 0.0084 0.084 0.100 0.920 -0.156 0.173
sin28 0.0570 0.084 0.680 0.497 -0.107 0.221
cos29 -0.0479 0.084 -0.572 0.568 -0.212 0.116
sin30 -0.0229 0.084 -0.273 0.785 -0.187 0.141
cos31 -0.0406 0.084 -0.485 0.628 -0.205 0.124
sin32 -0.0245 0.084 -0.293 0.770 -0.189 0.140
cos33 0.0926 0.084 1.106 0.269 -0.072 0.257
sin34 0.0364 0.084 0.435 0.664 -0.128 0.201
cos35 -0.0254 0.084 -0.303 0.762 -0.190 0.139
sin36 0.0200 0.084 0.238 0.812 -0.144 0.184
cos37 -0.0257 0.084 -0.307 0.759 -0.190 0.139
sin38 -0.0397 0.084 -0.474 0.635 -0.204 0.125
cos39 0.0203 0.084 0.243 0.808 -0.144 0.185
sin40 0.0311 0.084 0.371 0.711 -0.133 0.195
cos41 0.0235 0.084 0.281 0.779 -0.141 0.188
sin42 0.0100 0.084 0.119 0.905 -0.154 0.174
cos43 -0.0308 0.084 -0.368 0.713 -0.195 0.133
sin44 0.0564 0.084 0.674 0.501 -0.108 0.221
cos45 -0.0157 0.084 -0.188 0.851 -0.180 0.149
sin46 0.0156 0.084 0.186 0.852 -0.149 0.180
cos47 0.1048 0.084 1.252 0.211 -0.059 0.269
sin48 0.1151 0.084 1.375 0.170 -0.049 0.279
cos49 -0.0285 0.084 -0.340 0.734 -0.193 0.136
sin50 0.0624 0.084 0.746 0.456 -0.102 0.227
cos51 -0.0762 0.084 -0.910 0.363 -0.240 0.088
sin52 0.4035 0.084 4.819 0.000 0.239 0.568
cos53 0.1677 0.084 2.004 0.045 0.004 0.332
sin54 0.0233 0.084 0.278 0.781 -0.141 0.188
cos55 0.0425 0.084 0.508 0.611 -0.122 0.207
sin56 -0.0269 0.084 -0.321 0.748 -0.191 0.137
cos57 0.0041 0.084 0.049 0.961 -0.160 0.168
sin58 0.1123 0.084 1.341 0.180 -0.052 0.277
cos59 0.0315 0.084 0.376 0.707 -0.133 0.196
sin60 0.0351 0.084 0.419 0.675 -0.129 0.199
cos61 -0.0394 0.084 -0.471 0.638 -0.204 0.125
sin62 0.0186 0.084 0.222 0.824 -0.146 0.183
cos63 0.0418 0.084 0.499 0.618 -0.122 0.206
sin64 0.0348 0.084 0.416 0.677 -0.129 0.199
cos65 0.0453 0.084 0.541 0.589 -0.119 0.210
sin66 0.0663 0.084 0.792 0.429 -0.098 0.231
cos67 0.0202 0.084 0.241 0.810 -0.144 0.184
sin68 0.0028 0.084 0.034 0.973 -0.161 0.167
cos69 -0.0260 0.084 -0.311 0.756 -0.190 0.138
sin70 -0.0417 0.084 -0.498 0.619 -0.206 0.123
cos71 0.0698 0.084 0.834 0.404 -0.094 0.234
sin72 0.0064 0.084 0.077 0.939 -0.158 0.171
cos73 -0.0141 0.084 -0.169 0.866 -0.178 0.150
sin74 0.0415 0.084 0.496 0.620 -0.123 0.206
cos75 0.0460 0.084 0.549 0.583 -0.118 0.210
sin76 -0.0412 0.084 -0.492 0.623 -0.205 0.123
cos77 0.0240 0.084 0.286 0.775 -0.140 0.188
sin78 -0.0091 0.084 -0.109 0.913 -0.173 0.155
cos79 0.0136 0.084 0.162 0.871 -0.151 0.178
sin80 0.0002 0.084 0.002 0.998 -0.164 0.164
cos81 0.0038 0.084 0.045 0.964 -0.160 0.168
sin82 -0.0124 0.084 -0.148 0.883 -0.177 0.152
cos83 0.0722 0.084 0.863 0.388 -0.092 0.236
sin84 -0.0123 0.084 -0.147 0.883 -0.177 0.152
cos85 -0.0220 0.084 -0.263 0.793 -0.186 0.142
sin86 0.0236 0.084 0.282 0.778 -0.141 0.188
cos87 0.0218 0.084 0.260 0.795 -0.142 0.186
sin88 0.0183 0.084 0.218 0.827 -0.146 0.183
cos89 0.0133 0.084 0.159 0.873 -0.151 0.178
sin90 -0.0330 0.084 -0.394 0.693 -0.197 0.131
cos91 0.0073 0.084 0.087 0.931 -0.157 0.171
sin92 -0.0082 0.084 -0.098 0.922 -0.173 0.156
cos93 0.0346 0.084 0.414 0.679 -0.130 0.199
sin94 0.0085 0.084 0.102 0.919 -0.156 0.173
cos95 0.0278 0.084 0.332 0.740 -0.136 0.192
sin96 -0.0166 0.084 -0.198 0.843 -0.181 0.148
cos97 0.0087 0.084 0.104 0.917 -0.156 0.173
sin98 -0.0432 0.084 -0.516 0.606 -0.207 0.121
cos99 0.0131 0.084 0.157 0.875 -0.151 0.177
sin100 -0.0620 0.084 -0.741 0.459 -0.226 0.102
cos101 0.0939 0.084 1.122 0.262 -0.070 0.258
sin102 0.0341 0.084 0.408 0.684 -0.130 0.198
cos103 0.0299 0.084 0.358 0.721 -0.134 0.194
sin104 0.0169 0.084 0.201 0.840 -0.147 0.181
cos105 -0.0892 0.084 -1.065 0.287 -0.253 0.075
sin106 0.0246 0.084 0.294 0.769 -0.140 0.189
cos107 0.0299 0.084 0.358 0.721 -0.134 0.194
sin108 0.0271 0.084 0.324 0.746 -0.137 0.191
cos109 -0.0082 0.084 -0.098 0.922 -0.172 0.156
sin110 0.0116 0.084 0.138 0.890 -0.153 0.176
cos111 -0.0219 0.084 -0.262 0.793 -0.186 0.142
sin112 -0.0021 0.084 -0.025 0.980 -0.166 0.162
cos113 0.0429 0.084 0.513 0.608 -0.121 0.207
sin114 0.0414 0.084 0.494 0.621 -0.123 0.206
cos115 0.0597 0.084 0.714 0.476 -0.104 0.224
sin116 0.0550 0.084 0.657 0.511 -0.109 0.219
cos117 -0.0499 0.084 -0.597 0.551 -0.214 0.114
sin118 -0.0129 0.084 -0.154 0.878 -0.177 0.151
cos119 -0.0175 0.084 -0.209 0.835 -0.182 0.147
sin120 -0.0140 0.084 -0.167 0.867 -0.178 0.150
cos121 0.0203 0.084 0.242 0.809 -0.144 0.184
sin122 0.0187 0.084 0.223 0.824 -0.146 0.183
cos123 -0.0063 0.084 -0.075 0.940 -0.170 0.158
sin124 0.0650 0.084 0.776 0.438 -0.099 0.229
cos125 0.0355 0.084 0.424 0.672 -0.129 0.200
sin126 -0.0550 0.084 -0.657 0.511 -0.219 0.109
cos127 0.0042 0.084 0.050 0.960 -0.160 0.168
sin128 0.0454 0.084 0.543 0.588 -0.119 0.210
cos129 -0.0034 0.084 -0.041 0.968 -0.168 0.161
sin130 -0.0471 0.084 -0.562 0.574 -0.211 0.117
cos131 -0.0574 0.084 -0.686 0.493 -0.222 0.107
sin132 0.0390 0.084 0.466 0.641 -0.125 0.203
cos133 0.0733 0.084 0.876 0.381 -0.091 0.237
sin134 -0.0535 0.084 -0.640 0.523 -0.218 0.111
cos135 0.0414 0.084 0.495 0.621 -0.123 0.206
sin136 -0.0362 0.084 -0.432 0.666 -0.200 0.128
cos137 0.0250 0.084 0.299 0.765 -0.139 0.189
sin138 -0.0246 0.084 -0.294 0.769 -0.189 0.140
cos139 -0.0089 0.084 -0.106 0.915 -0.173 0.155
sin140 -0.0005 0.084 -0.006 0.996 -0.165 0.164
cos141 -0.0112 0.084 -0.134 0.894 -0.175 0.153
sin142 -0.0091 0.084 -0.108 0.914 -0.173 0.155
cos143 0.0227 0.084 0.271 0.786 -0.141 0.187
sin144 -0.0516 0.084 -0.617 0.538 -0.216 0.113
cos145 -0.0870 0.084 -1.040 0.299 -0.251 0.077
sin146 0.0457 0.084 0.546 0.585 -0.119 0.210
cos147 0.0221 0.084 0.265 0.791 -0.142 0.186
sin148 -0.0271 0.084 -0.324 0.746 -0.191 0.137
cos149 -0.0324 0.084 -0.388 0.698 -0.197 0.132
sin150 0.0243 0.084 0.290 0.772 -0.140 0.189
cos151 0.0119 0.084 0.142 0.887 -0.152 0.176
sin152 -0.0358 0.084 -0.428 0.669 -0.200 0.128
cos153 -0.0109 0.084 -0.130 0.897 -0.175 0.153
sin154 -0.0270 0.084 -0.323 0.747 -0.191 0.137
cos155 -0.0074 0.084 -0.088 0.930 -0.171 0.157
sin156 0.0163 0.084 0.194 0.846 -0.148 0.180
cos157 0.0038 0.084 0.046 0.963 -0.160 0.168
sin158 0.0107 0.084 0.128 0.898 -0.154 0.175
cos159 0.0277 0.084 0.331 0.741 -0.136 0.192
sin160 -0.0483 0.084 -0.578 0.564 -0.213 0.116
cos161 0.0073 0.084 0.087 0.930 -0.157 0.171
sin162 0.0127 0.084 0.152 0.880 -0.152 0.177
cos163 0.0666 0.084 0.796 0.426 -0.097 0.231
sin164 0.0210 0.084 0.251 0.802 -0.143 0.185
cos165 0.0047 0.084 0.056 0.955 -0.159 0.169
sin166 -0.0403 0.084 -0.482 0.630 -0.205 0.124
cos167 0.0114 0.084 0.137 0.891 -0.153 0.176
sin168 0.0168 0.084 0.201 0.841 -0.147 0.181
cos169 0.0014 0.084 0.017 0.986 -0.163 0.166
sin170 0.0197 0.084 0.235 0.814 -0.145 0.184
cos171 -0.0132 0.084 -0.157 0.875 -0.178 0.151
sin172 0.0251 0.084 0.299 0.765 -0.140 0.190
cos173 0.0625 0.084 0.744 0.457 -0.102 0.227
sin174 0.0002 0.084 0.002 0.998 -0.165 0.165
cos175 0.0090 0.084 0.107 0.915 -0.156 0.174
sin176 0.0341 0.084 0.405 0.685 -0.131 0.199
cos177 0.0066 0.084 0.079 0.937 -0.158 0.171
sin178 -0.0362 0.084 -0.431 0.667 -0.201 0.129
cos179 0.0700 0.084 0.835 0.404 -0.094 0.234
sin180 -0.0575 0.084 -0.687 0.492 -0.222 0.107
cos181 0.0302 0.083 0.362 0.718 -0.133 0.194
sin182 0.0212 0.082 0.258 0.797 -0.140 0.182
cos183 0.0311 0.086 0.360 0.719 -0.138 0.200
sin184 0.0306 0.085 0.361 0.718 -0.136 0.197
cos185 -0.0923 0.085 -1.092 0.275 -0.258 0.074
sin186 -0.0769 0.084 -0.910 0.363 -0.243 0.089
cos187 0.0263 0.084 0.312 0.755 -0.139 0.192
sin188 -0.0057 0.084 -0.068 0.946 -0.171 0.160
cos189 -0.0347 0.084 -0.411 0.681 -0.200 0.131
sin190 0.0338 0.084 0.401 0.688 -0.132 0.199
cos191 0.0121 0.084 0.143 0.886 -0.153 0.177
sin192 -0.0058 0.084 -0.069 0.945 -0.171 0.160
cos193 0.0011 0.084 0.014 0.989 -0.164 0.166
sin194 -0.0304 0.084 -0.361 0.718 -0.195 0.135
==============================================================================
Omnibus: 167.262 Durbin-Watson: 0.768
Prob(Omnibus): 0.000 Jarque-Bera (JB): 242.073
Skew: 0.892 Prob(JB): 2.72e-53
Kurtosis: 4.028 Cond. No. 1.25e+03
==============================================================================
Warnings:
[1] Standard Errors assume that the covariance matrix of the errors is correctly specified.
[2] The condition number is large, 1.25e+03. This might indicate that there are
strong multicollinearity or other numerical problems.
Données “Trafic internet”
8) Importez les données du fichier lbl-tcp-3.tcp. Chaque ligne du tableau correspond à un paquet et la première variable et le moment de sa transmission ; consultez ftp://ita.ee.lbl.gov/html/ contrib/LBL-TCP-3.html pour plus d’information sur les données. Affichez 5 premières lignes du jeu de données. Tout d’abord, créez la série temporelle, où chaque observation correspond au nombre de paquets transmis dans un intervalle de 10 secondes. Il y a 720 intervalles, donc vous devez obtenir 720 observations. Tracez la série temporelle obtenue.
col_names = ["timestamp", "sourceHost", "destinationHost",
             "sourceTCPPort", "destinationTCPPort", "bytes"]
df2 = pd.read_csv("lbl-tcp-3.tcp", delimiter=" ", names=col_names, header=None)
df2.head()
| timestamp | sourceHost | destinationHost | sourceTCPPort | destinationTCPPort | bytes | |
|---|---|---|---|---|---|---|
| 0 | 7.591038e+08 | 1 | 2 | 23 | 2436 | 1 |
| 1 | 1.044500e-02 | 2 | 1 | 2436 | 23 | 2 |
| 2 | 2.377500e-02 | 1 | 2 | 23 | 2436 | 2 |
| 3 | 2.655800e-02 | 2 | 1 | 2436 | 23 | 1 |
| 4 | 2.900200e-02 | 3 | 4 | 3930 | 119 | 42 |
“The trace ran from 14:10 to 16:10 on Thursday, January 20, 1994 (times are Pacific Standard Time), capturing 1.8 million TCP packets (about 0.0002 of these were dropped). The tracing was done on the Ethernet DMZ network over which flows all traffic into or out of the Lawrence Berkeley Laboratory, located in Berkeley, California. The raw trace was made using tcpdump on a Sun Sparcstation using the BPF kernel packet filter. Timestamps have microsecond precision.”
df2['index'] = df2.index
df2['timedelta'] = df2['timestamp'].map(lambda x: datetime.timedelta(x))
df2.head()
| timestamp | sourceHost | destinationHost | sourceTCPPort | destinationTCPPort | bytes | index | timedelta | |
|---|---|---|---|---|---|---|---|---|
| 0 | 7.591038e+08 | 1 | 2 | 23 | 2436 | 1 | 0 | 759103800 days, 0:11:47.176208 |
| 1 | 1.044500e-02 | 2 | 1 | 2436 | 23 | 2 | 1 | 0:15:02.448000 |
| 2 | 2.377500e-02 | 1 | 2 | 23 | 2436 | 2 | 2 | 0:34:14.160000 |
| 3 | 2.655800e-02 | 2 | 1 | 2436 | 23 | 1 | 3 | 0:38:14.611200 |
| 4 | 2.900200e-02 | 3 | 4 | 3930 | 119 | 42 | 4 | 0:41:45.772800 |
df2.at[0, 'timedelta'] = 0
df2['timedelta'] = df2['timedelta']/86400
#df2.head()
# count the transferted parquets for every 10s
bytes_cum_array = []
bytes_cum = 0
#i = 0

for index in range(1, len(df2)-1):
    if index > 0:
        time_cum = df2.loc[index, 'timedelta'].total_seconds(
        ) - len(bytes_cum_array) * 10
        bytes_cum = bytes_cum + df2.loc[index, 'bytes']
        if time_cum >= 10:
            bytes_cum_array.append(bytes_cum)
            bytes_cum = 0
df_paquets = pd.DataFrame(bytes_cum_array, columns=['bytes'])
df_paquets['time'] = df_paquets.index
df_paquets.head()
| bytes | time | |
|---|---|---|
| 0 | 100180 | 0 |
| 1 | 128214 | 1 |
| 2 | 657071 | 2 |
| 3 | 165290 | 3 |
| 4 | 257638 | 4 |
sns.set()
plt.figure(figsize=(15, 8))
plt.subplot(2, 1, 1)
plt.plot(df_paquets['time'], df_paquets['bytes'])
plt.title("Nombre de bytes transmis par tranche de 10 secondes")
plt.subplot(2, 1, 2)
plt.title("Nombre de bytes transmis par tranche de 10 secondes")
plt.scatter(df_paquets['time'], df_paquets['bytes'])
plt.show()
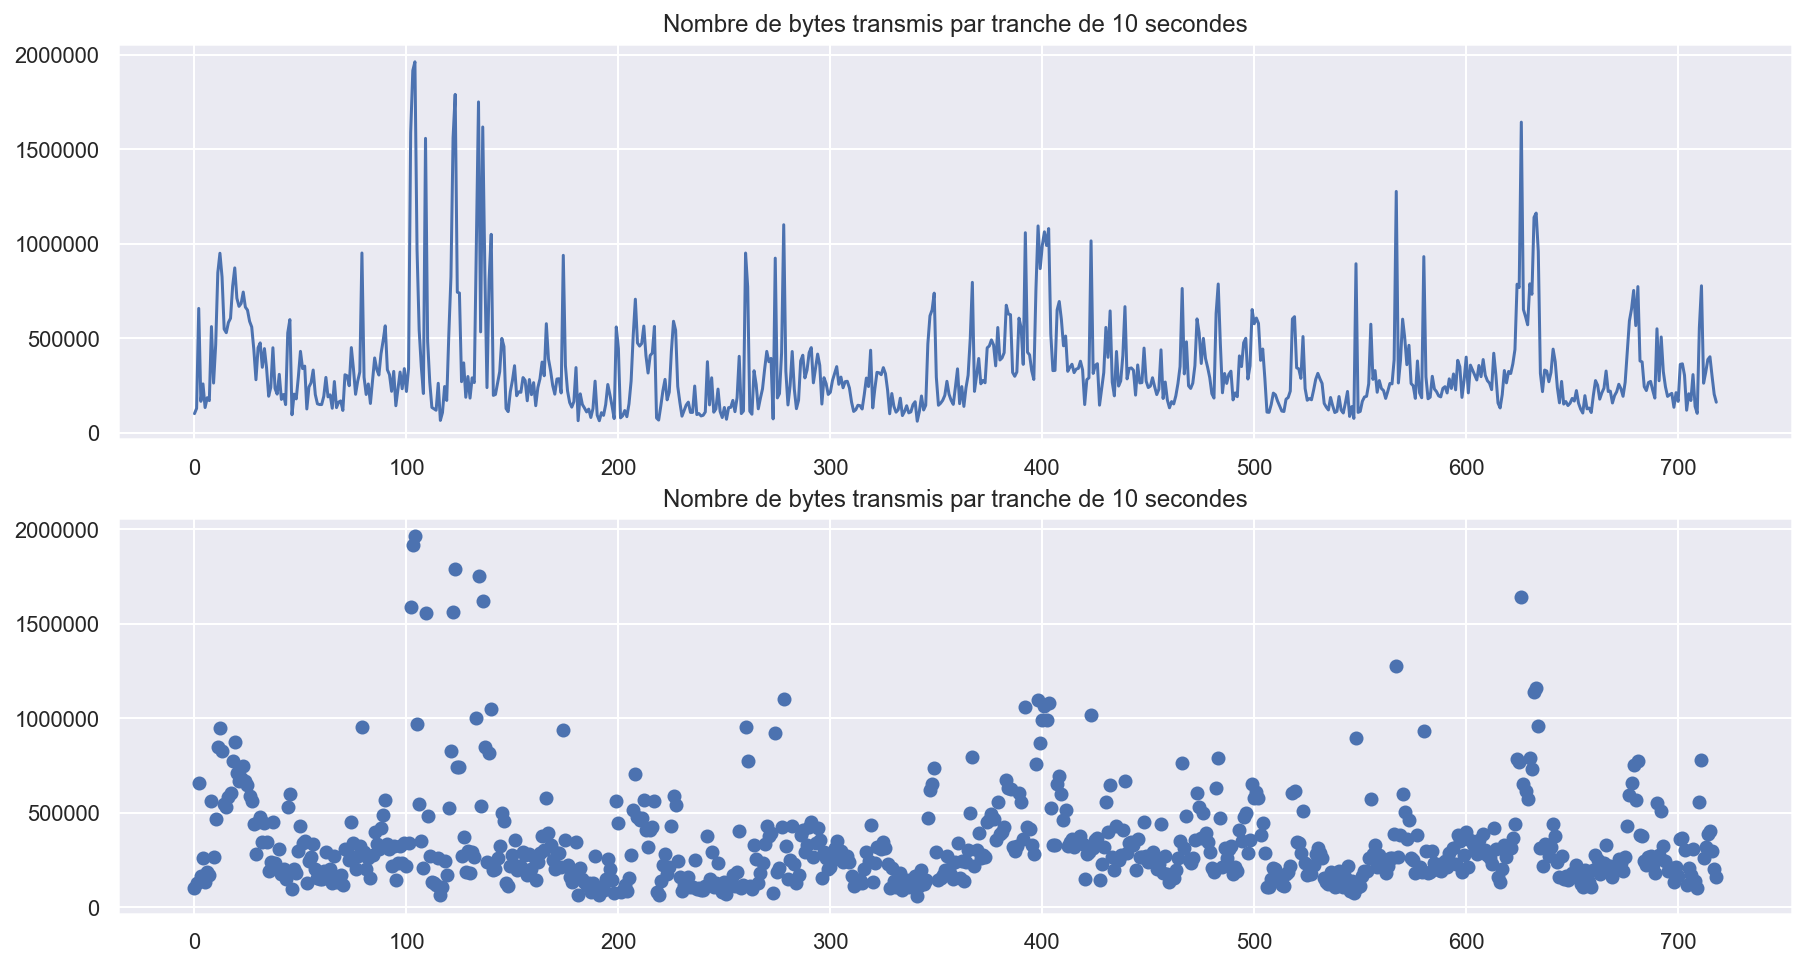
On voit sur le graphe que cette serie temporelle est stationnaire. On peut utiliser le modèle yt = a1yt-1 + ϵt avec d=0.
sns.set()
plt.figure(figsize=(15,5))
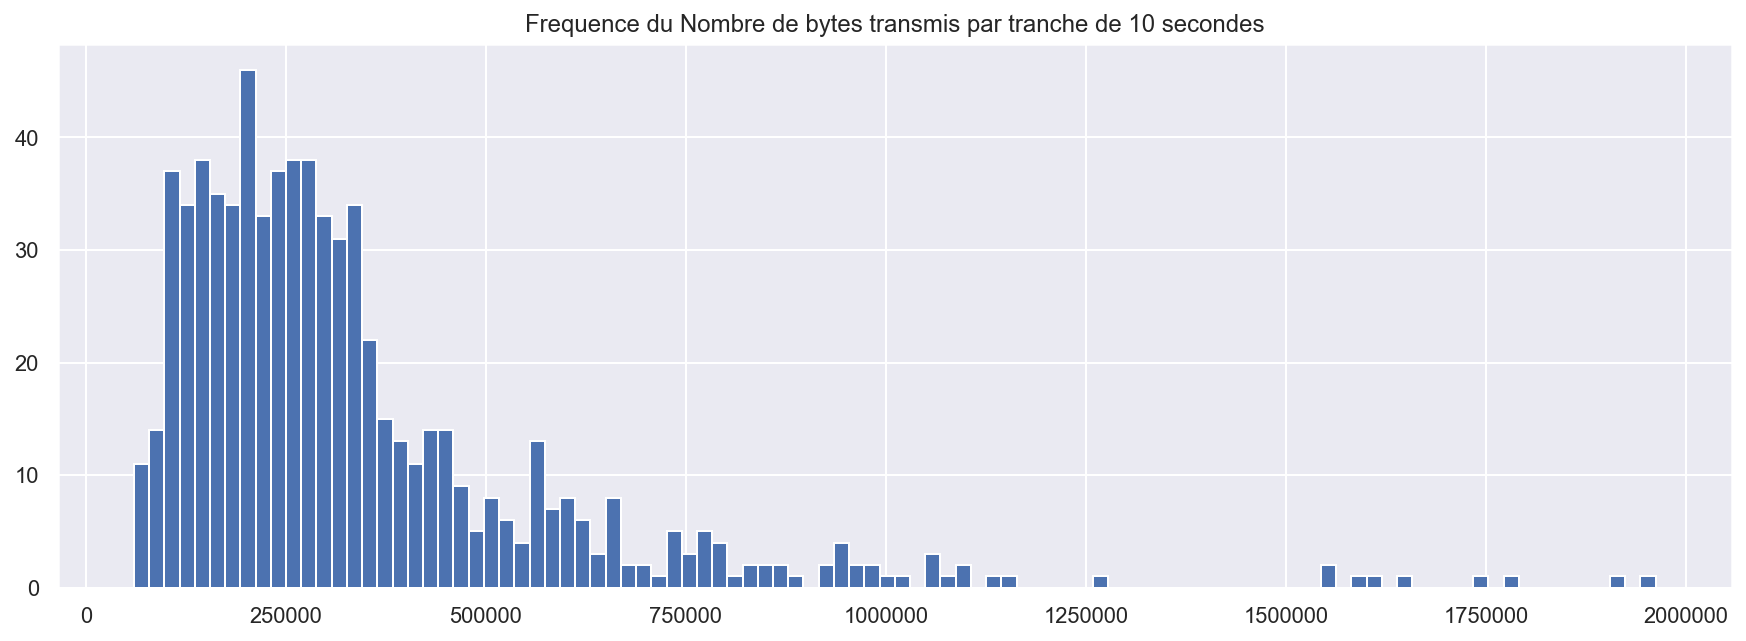
plt.hist( df_paquets['bytes'],bins=100)
plt.title("Frequence du Nombre de bytes transmis par tranche de 10 secondes")
plt.show()
from pandas.plotting import autocorrelation_plot
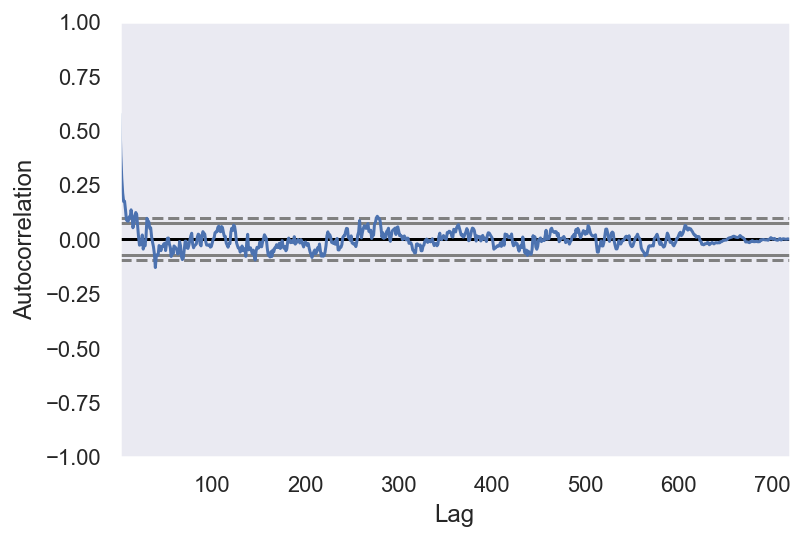
autocorrelation_plot(df_paquets['bytes'])
<matplotlib.axes._subplots.AxesSubplot at 0x1c3116bc18>
from statsmodels.graphics.tsaplots import plot_acf
plot_acf(df_paquets['bytes'], lags=40)
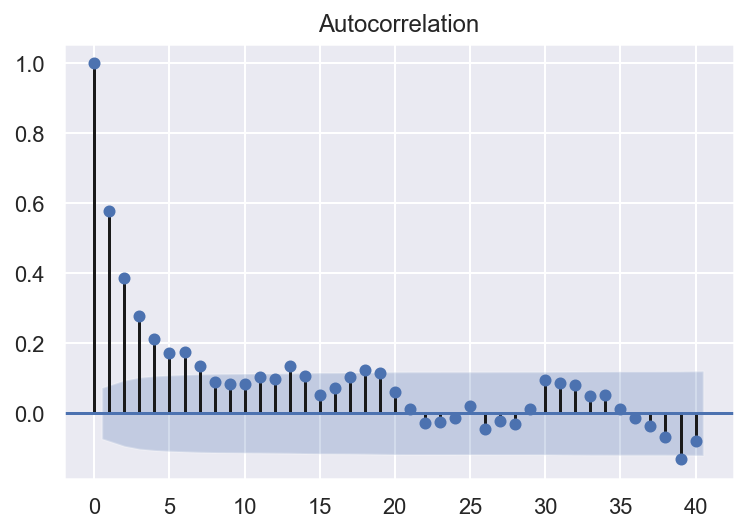
Nous pouvons voir qu’il existe une corrélation positive avec les 21 premiers lags, et le permiers 4 lags sont au dessus de 0.2.
Un bon point de départ pour le paramètre AR du modèle peut être 4.
- Dans cette question on vous propose de construire un modèle auto-régressif AR(p). L’apprentissage du modèle ne demande pas beaucoup de temps et s’effectue avec 1 − 2 ligne de code à l’aide de la fonction ARIMA() importée de statsmodels.tsa.arima_model. Le choix du paramètre p (d’une gamme de valeur prédéfinies, disons de 1 à pmax) est moins simple. On va aborder trois possibilité : critère d’information d’Akaike (AIC), critère d’information bayésien (BIC) et validation croisée/backtesting.
df_paquets.count()
bytes    719
time     719
dtype: int64
from statsmodels.tsa.arima_model import ARIMA
from statsmodels.tsa.arima_model import ARMA
import statsmodels.graphics.tsaplots as tsaplots

'''The parameters of the ARIMA model are defined as follows:
p: The number of lag observations included in the model, also called the lag order.
d: The number of times that the raw observations are differenced, also called the degree of differencing.
q: The size of the moving average window, also called the order of moving average.'''
# Autocorrélation du permier lag est significatif.Un bon point de départ
# pour le paramètre p peut être 1.
# The data is stationary, no need difference ordre , so d = 0.

arima = ARIMA(df_paquets['bytes'].loc[:500], order=(4, 0, 0))
arima = arima.fit()
print(arima.summary())
                              ARMA Model Results
==============================================================================
Dep. Variable:                  bytes   No. Observations:                  501
Model:                     ARMA(4, 0)   Log Likelihood               -6877.425
Method:                       css-mle   S.D. of innovations         221467.441
Date:                Sun, 26 Jan 2020   AIC                          13766.850
Time:                        22:05:56   BIC                          13792.149
Sample:                             0   HQIC                         13776.776

===============================================================================
                  coef    std err          z      P>|z|      [0.025      0.975]
-------------------------------------------------------------------------------
const        3.514e+05   2.62e+04     13.418      0.000       3e+05    4.03e+05
ar.L1.bytes     0.5522      0.045     12.372      0.000       0.465       0.640
ar.L2.bytes     0.0292      0.051      0.571      0.569      -0.071       0.129
ar.L3.bytes     0.0308      0.051      0.599      0.549      -0.070       0.131
ar.L4.bytes     0.0115      0.045      0.256      0.798      -0.077       0.100
                                    Roots
=============================================================================
                  Real          Imaginary           Modulus         Frequency
-----------------------------------------------------------------------------
AR.1            1.4431           -0.0000j            1.4431           -0.0000
AR.2            0.3899           -3.4847j            3.5065           -0.2323
AR.3            0.3899           +3.4847j            3.5065            0.2323
AR.4           -4.8975           -0.0000j            4.8975           -0.5000
-----------------------------------------------------------------------------
# plot residual errors
sns.set()
plt.figure(figsize=(15, 7))
plt.subplot(2, 1, 1)
plt.plot(arima.resid)

plt.subplot(2, 1, 2)
plt.hist(arima.resid, bins=50)
plt.show()

print(arima.resid.describe())
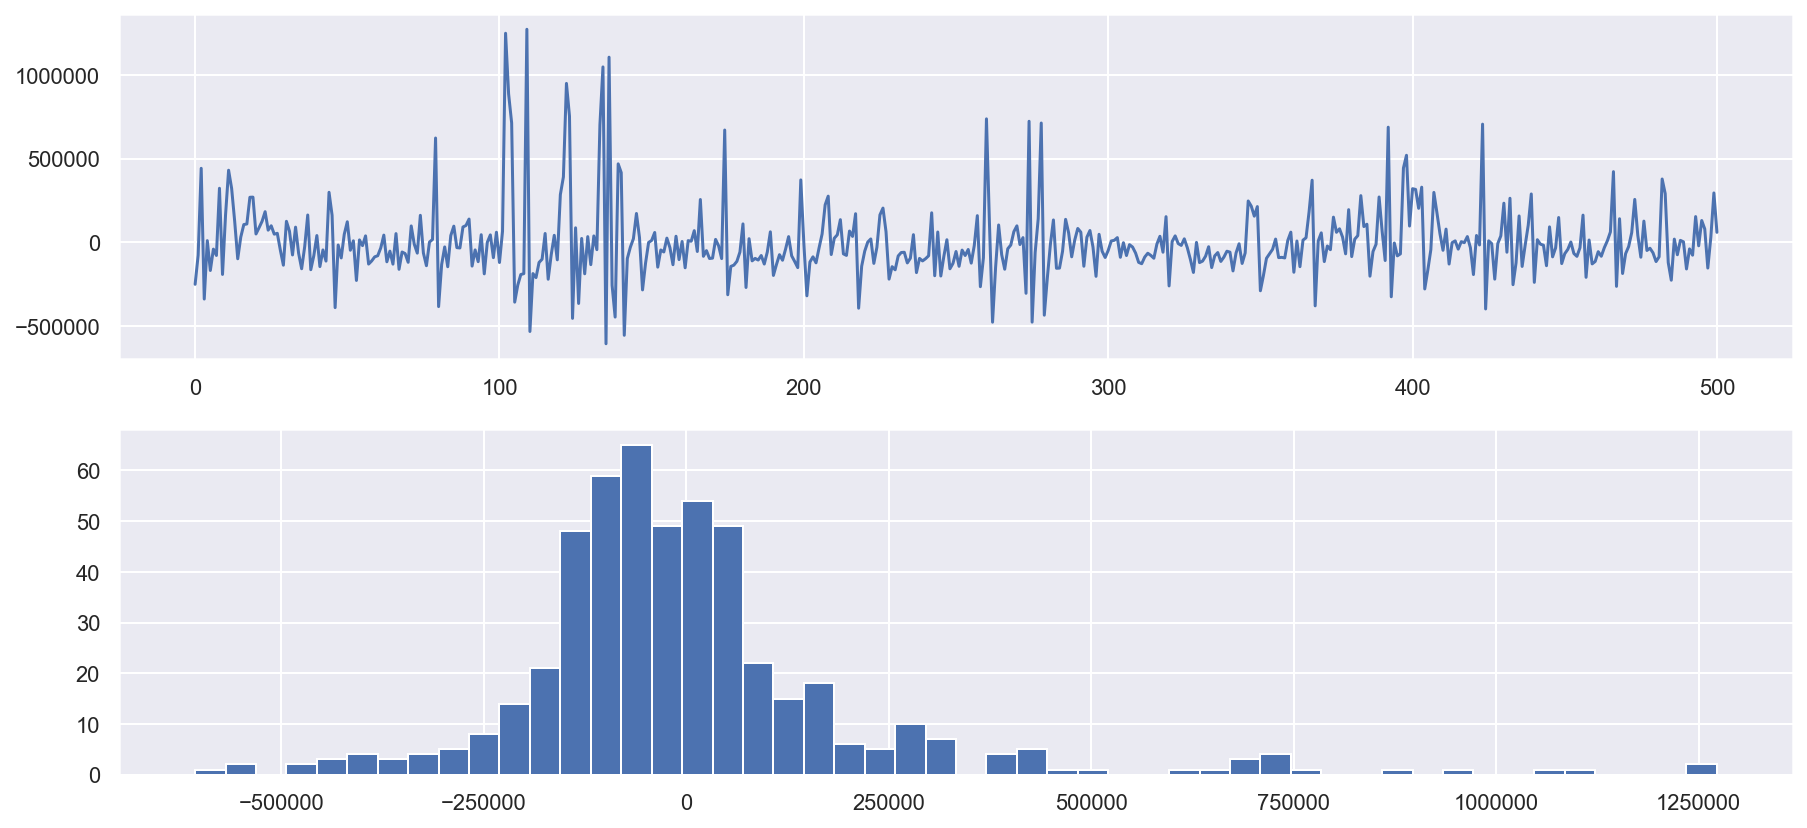
count    5.010000e+02
mean     3.513440e+02
std      2.217877e+05
min     -6.062925e+05
25%     -1.116478e+05
50%     -3.323118e+04
75%      5.858698e+04
max      1.272707e+06
dtype: float64
# plot the prediction of ARIMA(20,0,0)
plt.figure(figsize=(12, 5))
plt.plot(df_paquets['bytes'].loc[:500], label="Train", alpha=0.8)
plt.plot(df_paquets['bytes'].loc[500:], label="Test", alpha=0.8)
plt.plot(arima.predict(start=0, end=500), label="Fit", alpha=0.4)
plt.plot(arima.predict(start=500, end=720), label="Pred")
plt.title('prediction of ARIMA(20,0,0)')
plt.legend()
plt.show()
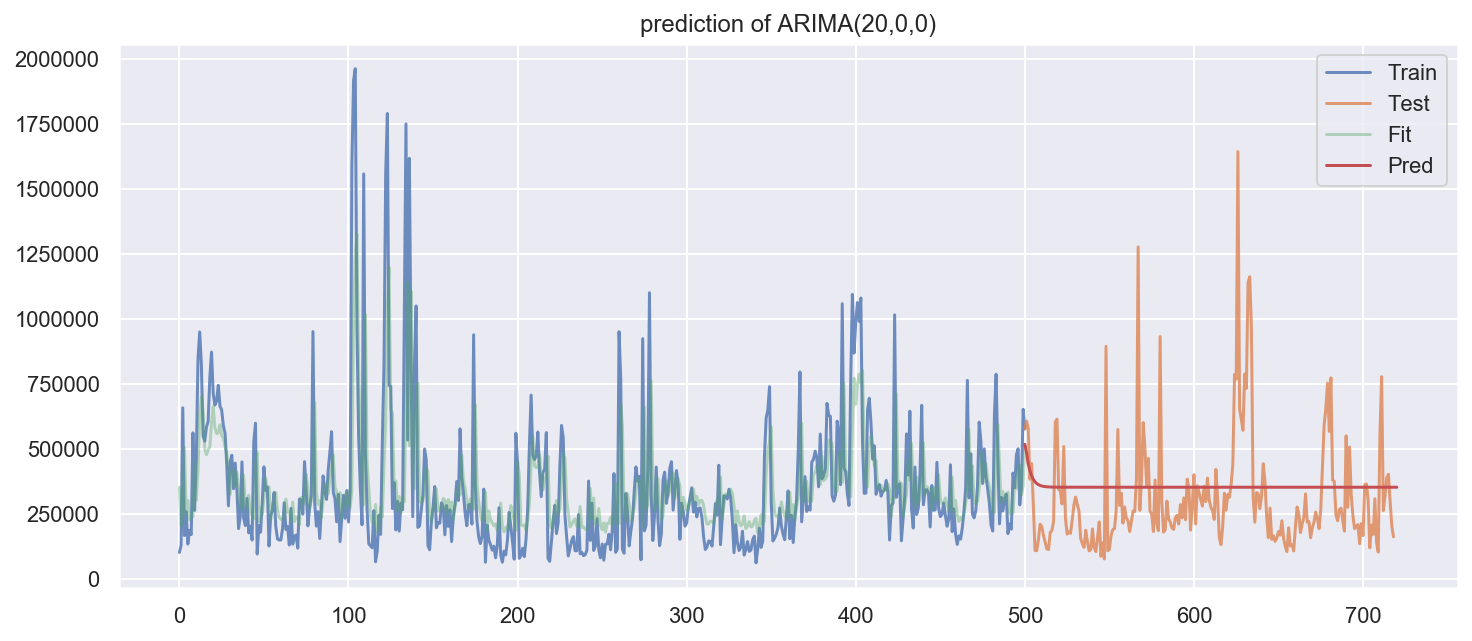
Le critères d’information AIC et BIC sont normalement implémentés dans le logiciel et sont donnés directement après l’apprentissage du modèle. Pour faire la validation croisée pour une série, on la coupe en nchunks chunks/folds et chaque fois utilise k premiers chunks pour entrainer le modèle et le chunk numéro k + 1 pour le tester (par exemple regarder le risque quadratique). Pour une gamme de valeur choisie, effectue les trois méthodes de la sélection du modèle.
# Home made cross validation on time series,
# can also use scikit-learning sklearn.model_selection.TimeSeriesSplit
n_splits = 5
k = 0
mse_ts = []
total = len(df_paquets)
for i in range(1, n_splits):
    k = k + int(total/n_splits)
    ar = ARIMA(df_paquets['bytes'].loc[:k], order=(
        8, 0, 0))  # here put 8 to save time
    model_fit = ar.fit()

    print("TRAIN:1-", k, "   TEST:", k, "-", total)
    pred = model_fit.predict(start=k, end=total)
    mse_ts.append(mean_squared_error(pred, df_paquets['bytes'].loc[k-1:]))
TRAIN:1- 143    TEST: 143 - 719
TRAIN:1- 286    TEST: 286 - 719
TRAIN:1- 429    TEST: 429 - 719
TRAIN:1- 572    TEST: 572 - 719
print(mse_ts)
np.mean(mse_ts)
[60735072155.39088, 45010625429.01087, 42657761907.51631, 50221730977.072014]


49656297617.24752
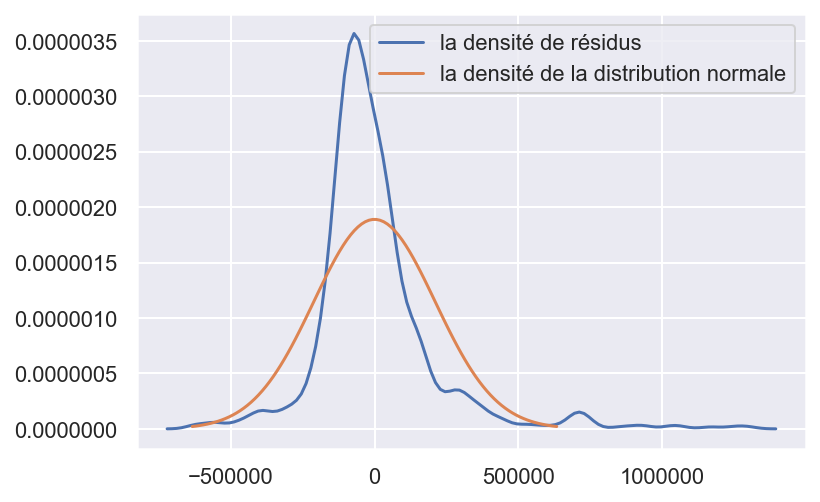
- En se basant sur les résultats de la question précédente, sélectionnez l’ordre p du modèle AR à estimer et affichez les paramètres correspondants. Tracez les résidus. Tracez l’estimation de la densité de résidus et la densité de la distribution normale (avec moyenne et écart-type estimés) sur le même graphique et comparez les visuellement. Commentez.
#choose p with AIC BIC
aic = []
bic = []
for p in range(1,9):

    ar = ARIMA(df_paquets['bytes'], order=(p,0,0))
    model_fit = ar.fit()
    aic.append(model_fit.aic)
    bic.append(model_fit.bic)

plt.plot(aic)
plt.plot(bic)
[<matplotlib.lines.Line2D at 0x1c315199b0>]
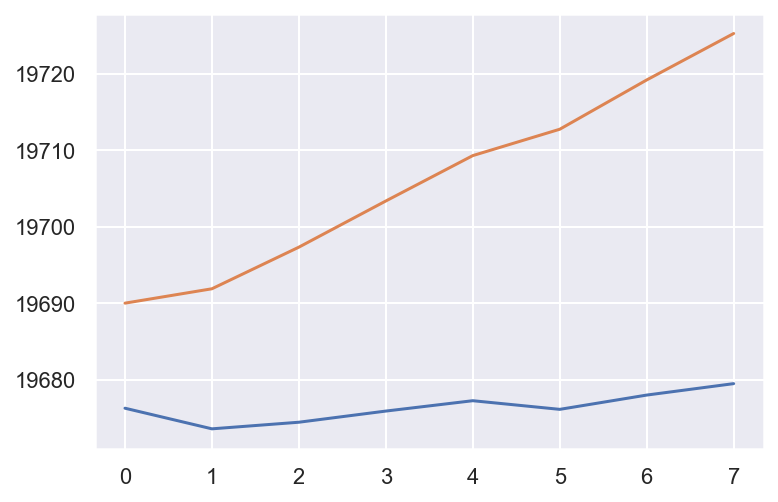
With the best AIC, BIC value : p=1
# cross validation to choose p
n_splits = 5
mse_ts_cv = []
for p in range(1, 12):
    k = 0
    mse_ts = []
    total = len(df_paquets)
    for i in range(1, n_splits):
        k = k + int(total/n_splits)
        # try different p
        ar = ARIMA(df_paquets['bytes'].loc[:k], order=(p, 0, 0))
        model_fit = ar.fit()
        pred = model_fit.predict(start=k, end=total)
        mse = mean_squared_error(pred, df_paquets['bytes'].loc[k-1:])
        mse_ts.append(mse)
        # print("TRAIN:1-", k, "   TEST:", k,"-", total,"mse:",mse)
    mse_ts_cv.append(np.mean(mse_ts))

plt.plot(mse_ts_cv)
plt.show()
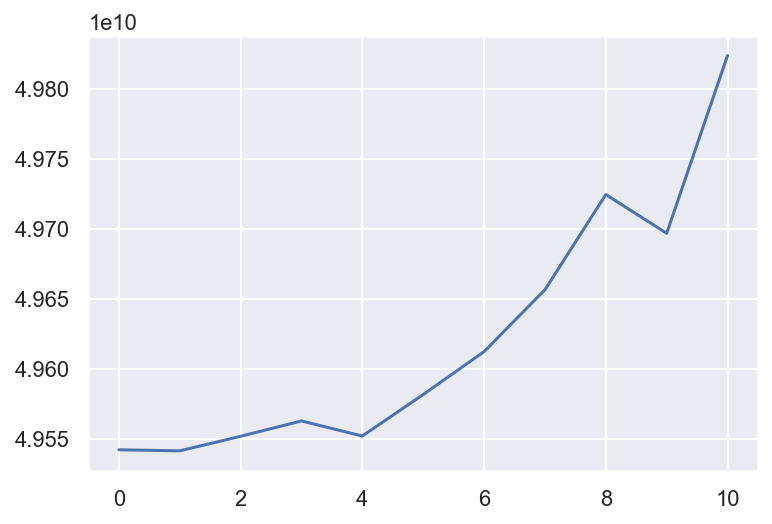
With the best MSE value using forward valitation: p=1
arima = ARIMA(df_paquets['bytes'], order=(1,0,0))
arima = arima.fit()

# plot residual errors
plt.figure(figsize=(12,5))
plt.plot(arima.resid,alpha=0.7)
plt.scatter(df_paquets['time'],arima.resid)
plt.title('Résidus')
plt.show()
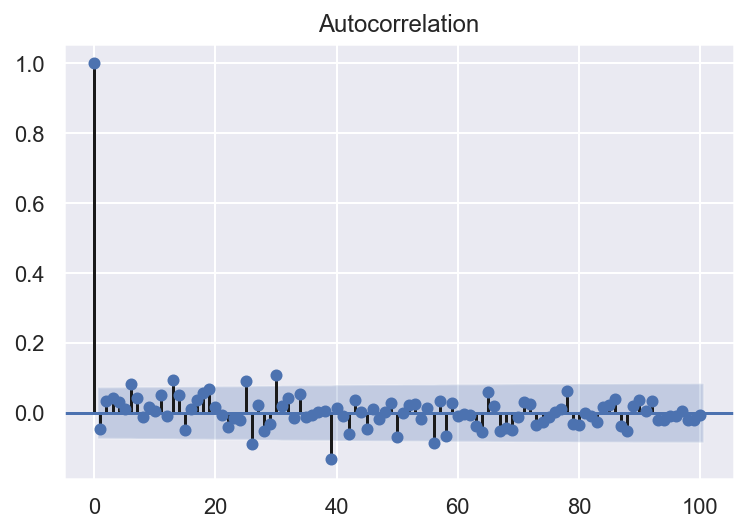
plot_acf(arima.resid, lags = 100)
arima.resid.describe()
count    7.190000e+02
mean    -1.433404e+02
std      2.112230e+05
min     -6.210341e+05
25%     -1.021981e+05
50%     -3.566584e+04
75%      5.537745e+04
max      1.294551e+06
dtype: float64
sns.set()
plt.figure()

sns.kdeplot(arima.resid, label='la densité de résidus')
# plt.hist(arima.resid,density=True,histtype='step',bins=100)

mu = np.mean(arima.resid)
variance = np.var(arima.resid)
sigma = math.sqrt(variance)
x = np.linspace(mu - 3*sigma, mu + 3*sigma, 100)
# (avec moyenne et écart-type estimés)
plt.plot(x, stats.norm.pdf(x, mu, sigma),
         label='la densité de la distribution normale')
plt.legend(loc='upper right')
plt.show()
from statsmodels.graphics.gofplots import qqplot
qqplot(arima.resid)
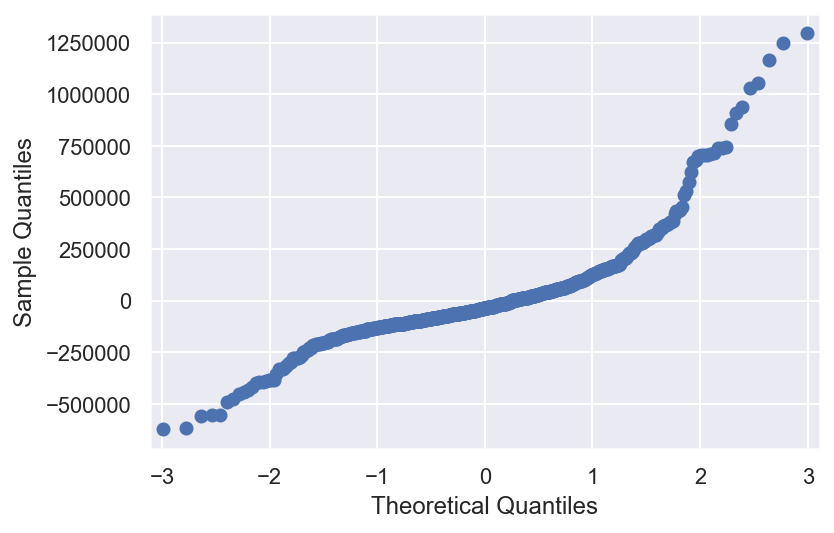
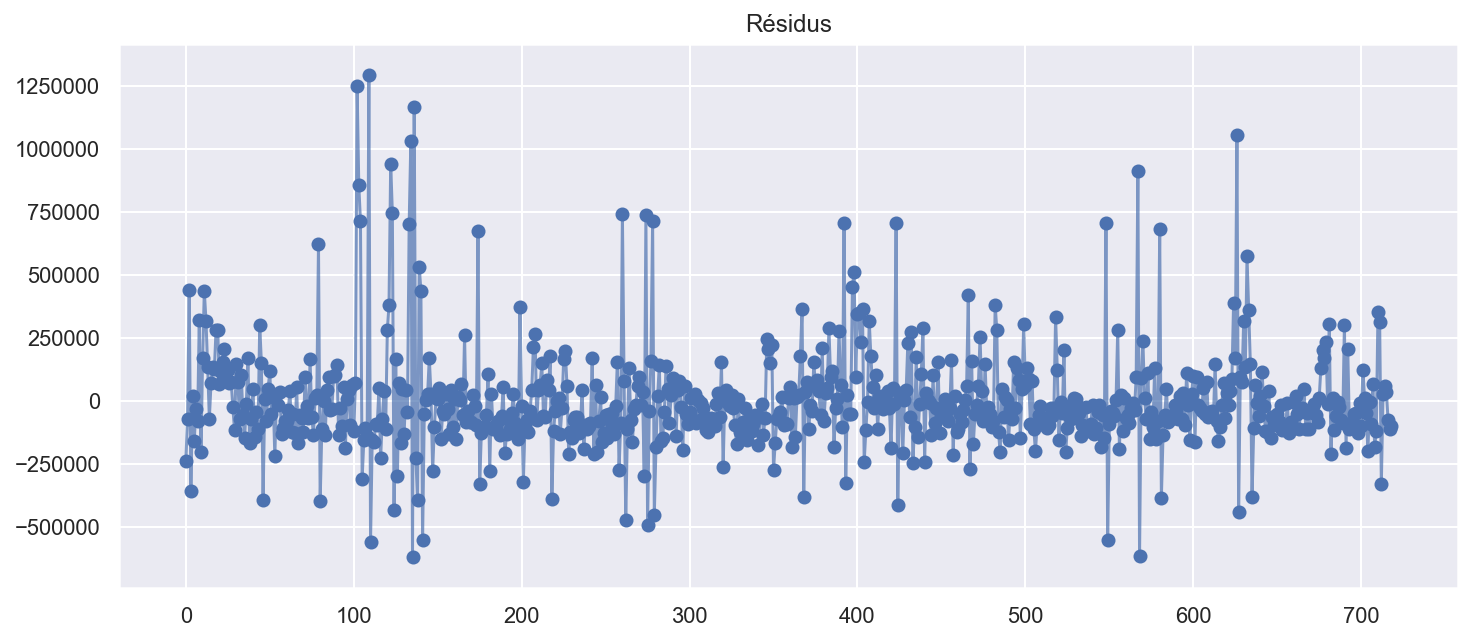
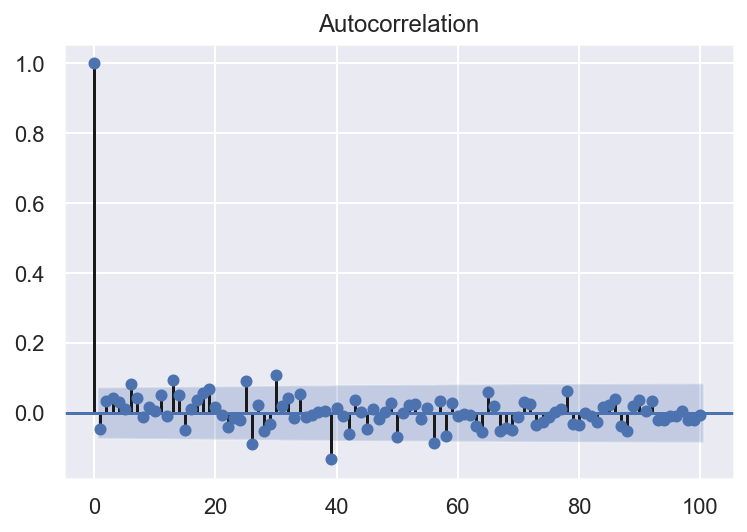
Les résidus sont utiles pour vérifier si un modèle a correctement saisi les informations dans les données. Le modèle ARIMA(1,0,0) est plutôt bien cars il donne des résidus avec les propriétés suivantes:
- Les résidus ne sont pas corrélés: il ne reste plus d’informations dans les résidus qui devraient être utilisées dans le calcul des prévisions.
- Les résidus ont une moyenne presque nulle(petit skewness). Les prévisions sont très légerement biaisées.
- Les résidus sont distribué selon une lois non-Gaussien (kurtosis non null), le modèle ne fit pas parfaitement les données (non-linéaire).
Données “Southern Oscillation Index”
- Importez les données du fichier soi.tsv. Consultez http://www.bom.gov.au/climate/glossary/soi.shtml pour plus d’information sur les données. Supprimez les données manquantes.
df3 = pd.read_csv("soi.tsv", delimiter="\t", header=None).T
df3.head()
| 0 | |
|---|---|
| 0 | 1.537160 |
| 1 | 0.922168 |
| 2 | -0.104204 |
| 3 | -0.291903 |
| 4 | -0.658745 |
plt.plot(df3)
[<matplotlib.lines.Line2D at 0x1c1b7a5cc0>]
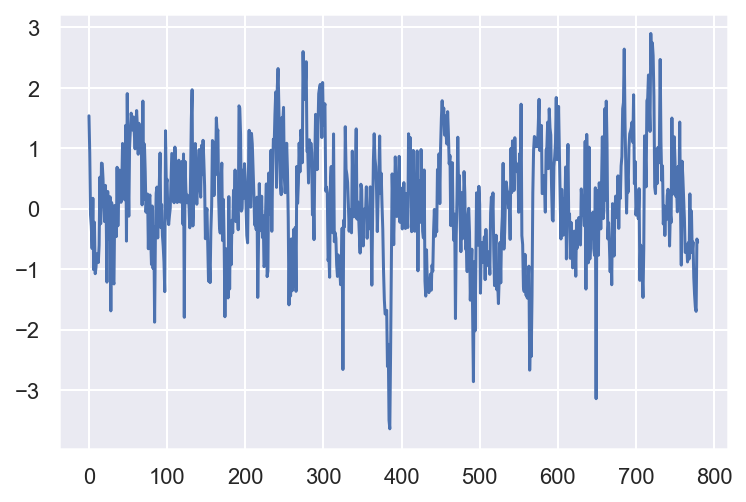
df3.describe()
| 0 | |
|---|---|
| count | 780.000000 |
| mean | 0.126377 |
| std | 0.947513 |
| min | -3.644050 |
| 25% | -0.482882 |
| 50% | 0.134003 |
| 75% | 0.761842 |
| max | 2.899500 |
df3 = df3.dropna()
- A l’aide des fonctions plot_acf() et plot_pacf() importées de statsmodels.graphics.tsaplots, tracez la fonction d’autocorrélation et la fonction d’autocorrélation partielle.
tsa.plot_acf(df3)
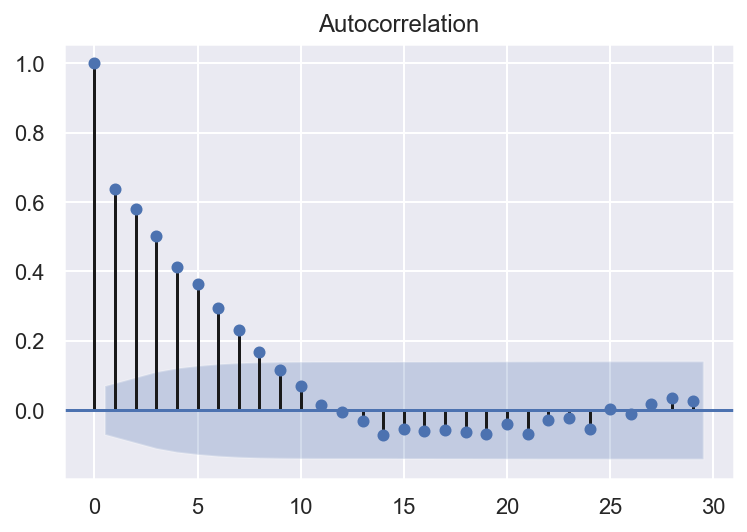
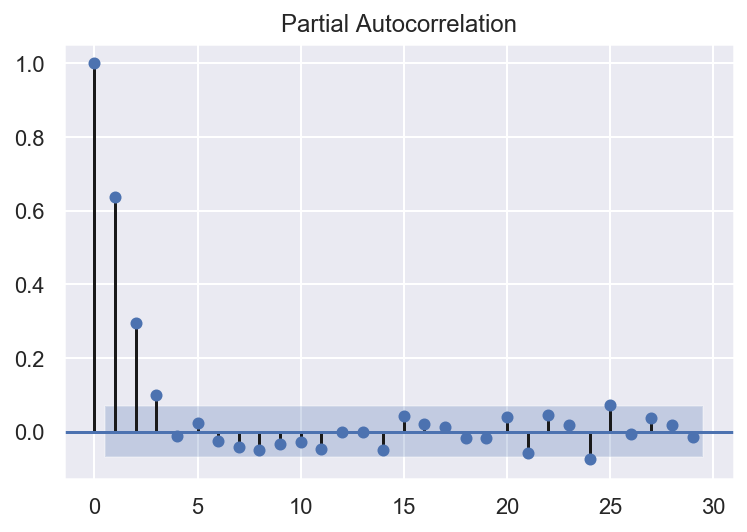
L’autorrelation partielle est significative jusqu’à environ un ordre de 11.
tsa.plot_pacf(df3)
- En se basant sur la question précédente, choisissez l’ordre du processus auto-régressive AR(p). Entrainer le modèle AR choisi.
aic = []
bic = []
for p in range(1, 19):

    ar = ARMA(df3, order=(p, 0))
    model_fit = ar.fit()
    aic.append(model_fit.aic)
    bic.append(model_fit.bic)

plt.plot(aic)
plt.plot(bic)
[<matplotlib.lines.Line2D at 0x1c333874a8>]
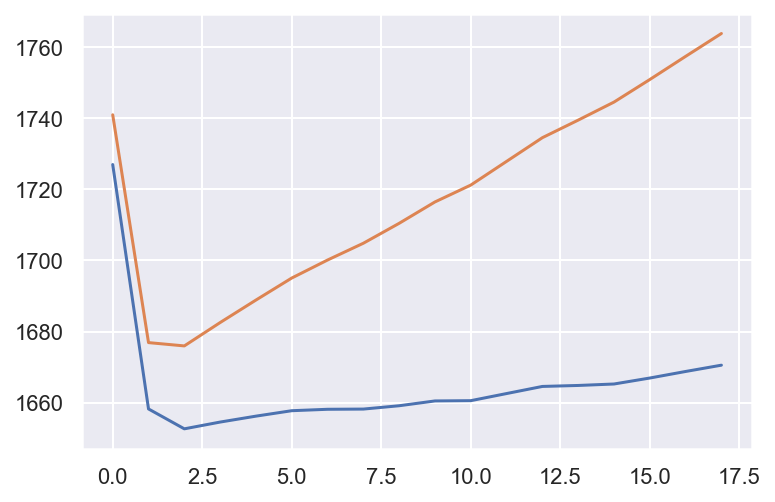
Le meilleur p=2.
ar = ARMA(df3, order=(2,0))
arma3 = ar.fit()
arma3.summary()
| Dep. Variable: | 0 | No. Observations: | 780 |
|---|---|---|---|
| Model: | ARMA(2, 0) | Log Likelihood | -825.133 |
| Method: | css-mle | S.D. of innovations | 0.697 |
| Date: | Sun, 26 Jan 2020 | AIC | 1658.265 |
| Time: | 22:19:05 | BIC | 1676.903 |
| Sample: | 0 | HQIC | 1665.434 |
| coef | std err | z | P>|z| | [0.025 | 0.975] | |
|---|---|---|---|---|---|---|
| const | 0.1293 | 0.097 | 1.328 | 0.184 | -0.061 | 0.320 |
| ar.L1.0 | 0.4507 | 0.034 | 13.175 | 0.000 | 0.384 | 0.518 |
| ar.L2.0 | 0.2945 | 0.034 | 8.603 | 0.000 | 0.227 | 0.362 |
| Real | Imaginary | Modulus | Frequency | |
|---|---|---|---|---|
| AR.1 | 1.2302 | +0.0000j | 1.2302 | 0.0000 |
| AR.2 | -2.7607 | +0.0000j | 2.7607 | 0.5000 |
Tracez les résidus. Tracez l’estimation de la densité de résidus et la densité de la distribution normale (avec moyenne et écart-type estimés) sur le même graphique et comparez les visuellement. Commentez.
# plot residual errors
sns.set()
plt.figure(figsize=(15, 7))
plt.subplot(2, 1, 1)
plt.plot(arma3.resid)

plt.subplot(2, 1, 2)
plt.hist(arma3.resid, bins=50)
plt.show()

print(arma3.resid.describe())
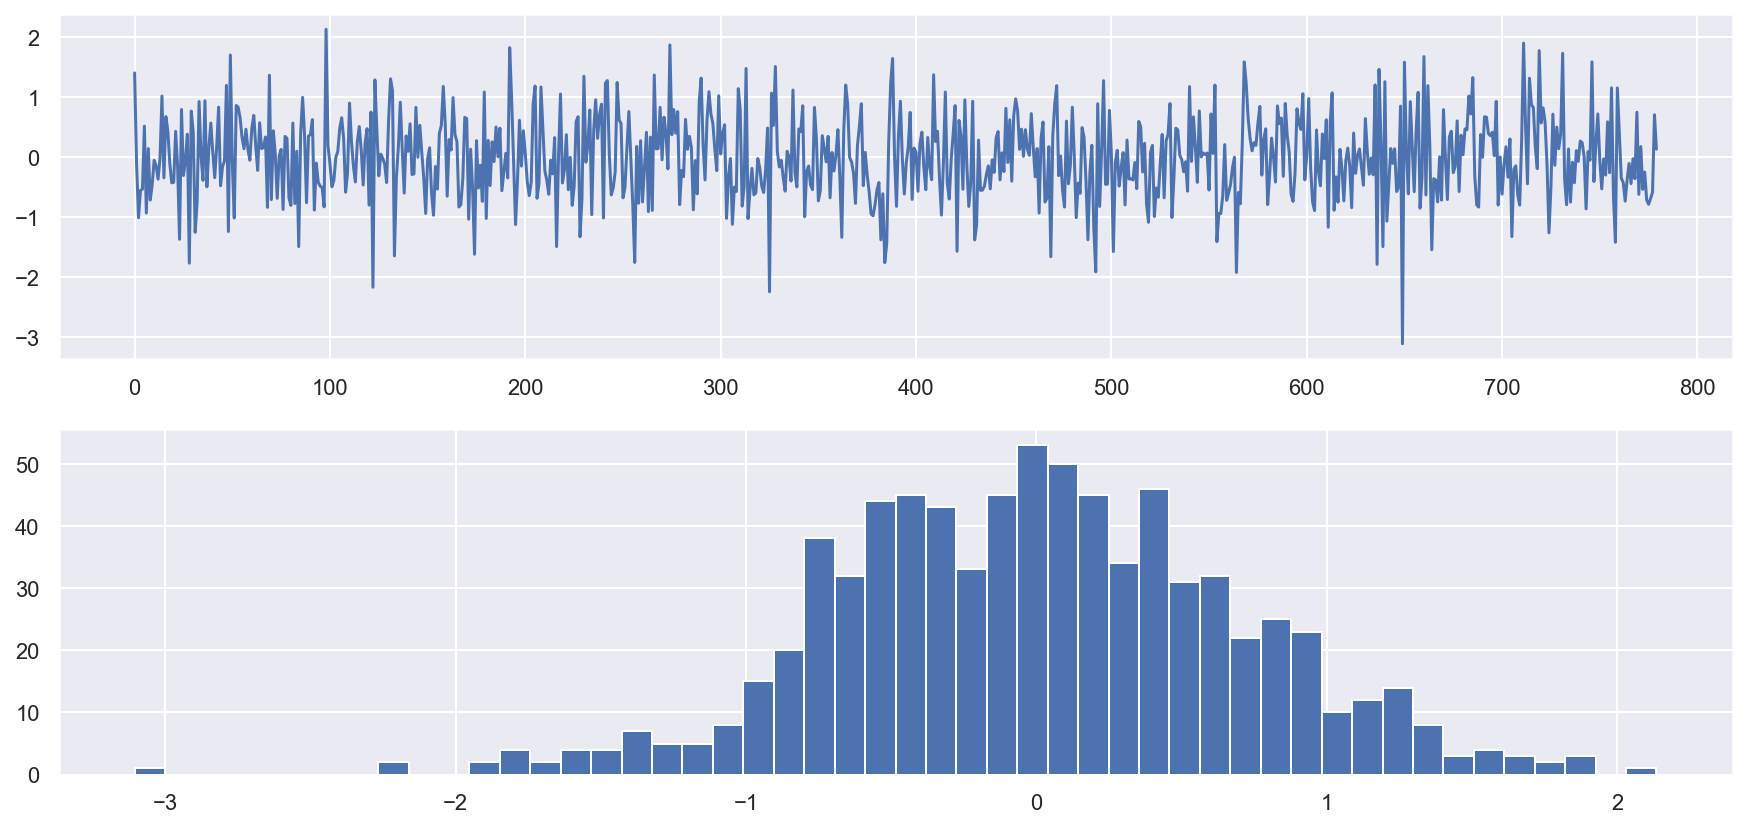
count    780.000000
mean      -0.001984
std        0.697894
min       -3.106289
25%       -0.479254
50%        0.001980
75%        0.450405
max        2.136042
dtype: float64
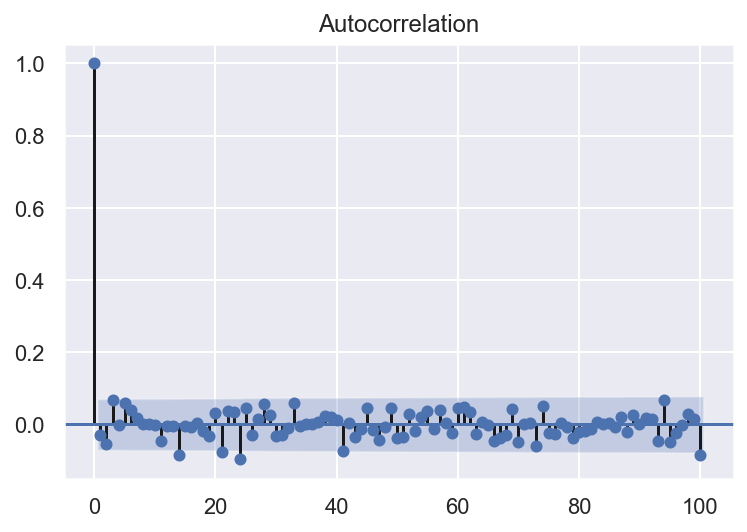
plot_acf(arma3.resid, lags=100)
sns.set()
plt.figure()

sns.kdeplot(arma3.resid, label='la densité de résidus')
# plt.hist(arima.resid,density=True,histtype='step',bins=100)

mu = np.mean(arma3.resid)
variance = np.var(arma3.resid)
sigma = math.sqrt(variance)
x = np.linspace(mu - 3*sigma, mu + 3*sigma, 100)
# (avec moyenne et écart-type estimés)
plt.plot(x, stats.norm.pdf(x, mu, sigma),
         label='la densité de la distribution normale')
plt.ylim(-0.1,0.8)
plt.legend(loc='upper left')
plt.show()
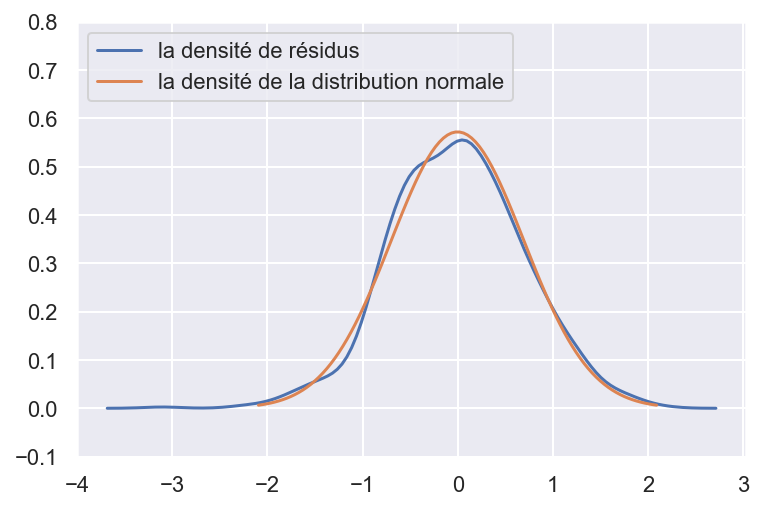
Les résidus sont distribués selon une loi normale. Les résidus ne sont pas autocorrélés. Le modèle ARMA(2,0) est satisfaisant.
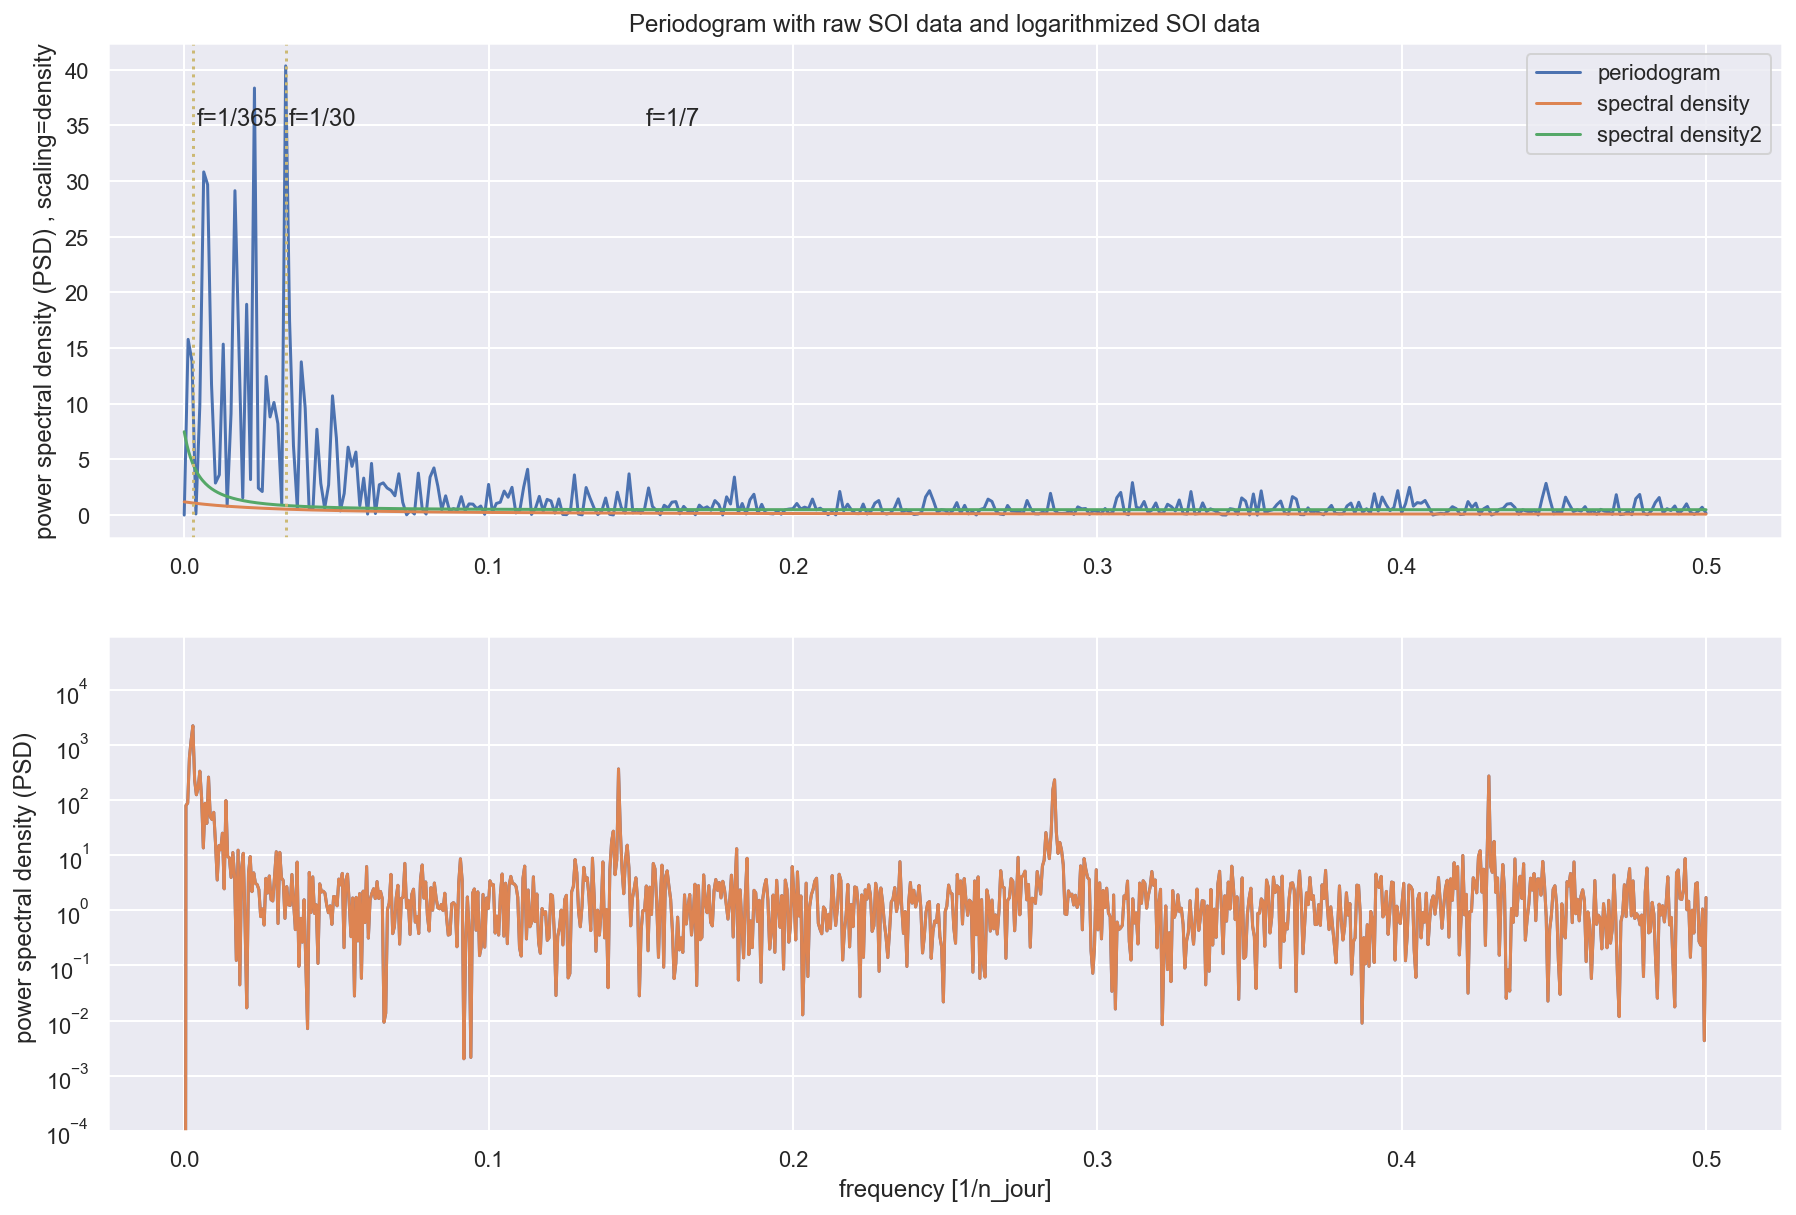
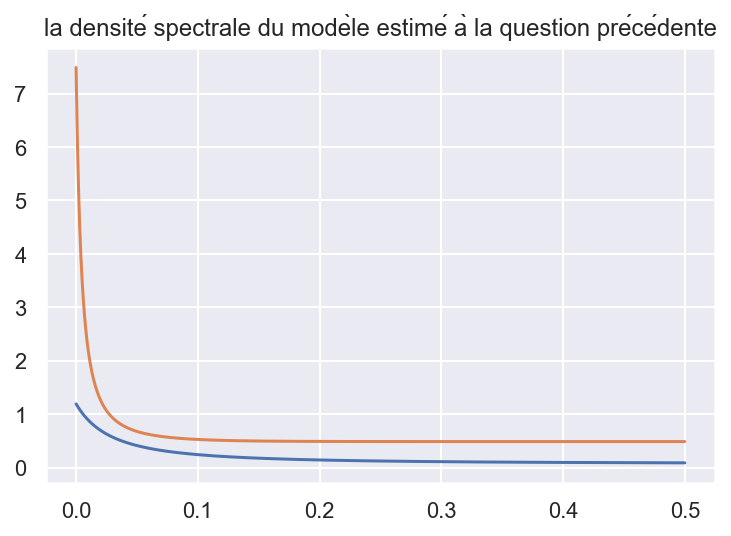
- Tracez le périodogramme ; superposez le à la densité spectrale du modèle estimé à la question précédente. On utilisera qu’un modèle AR(p) de coefficients auto-régressifs φ1, . . . , φp satisfaisant l’équation AR
#la densité spectrale
x = np.linspace(0, 0.5, 1000)
sd = (np.var(arma3.resid)/(2*np.pi))*1 / \
    (1-(arma3.arparams[0]*np.exp((-1)*i*x) +
        arma3.arparams[1]*np.exp((-2)*i*x)))**2
sd2 = (np.var(arma3.resid))*1 / \
    (1-(arma3.arparams[0]*np.exp(2*np.pi*(-1)*i*x) +
        arma3.arparams[1]*np.exp(2*np.pi*(-2)*i*x)))**2
plt.plot(x,sd)
plt.plot(x,sd2)
plt.title('la densité spectrale du modèle estimé à la question précédente')
Text(0.5, 1.0, 'la densité spectrale du modèle estimé à la question précédente')
sns.set()
plt.figure(figsize=(15, 10))
plt.subplot(2, 1, 1)

# calcul the spectral density using the formule
x = np.linspace(0, 0.5, 1000)
sd = (np.var(arma3.resid)/(2*np.pi))*1 / \
    (1-(arma3.arparams[0]*np.exp((-1)*i*x) +
        arma3.arparams[1]*np.exp((-2)*i*x)))**2
sd2 = (np.var(arma3.resid))*1 / \
    (1-(arma3.arparams[0]*np.exp(2*np.pi*(-1)*i*x) +
        arma3.arparams[1]*np.exp(2*np.pi*(-2)*i*x)))**2


# f : ndarray : Array of sample frequencies.
# Pxx : ndarray :Power spectral density or power spectrum of x.
f, Pxx_den = signal.periodogram(df3[0], scaling='density')
plt.plot(f, Pxx_den, label='periodogram')
plt.plot(x, sd, label='spectral density')
plt.plot(x, sd2, label='spectral density2')
plt.axvline(x=1/365, c='y', linestyle=':')
plt.axvline(x=1/30, c='y', linestyle=':')
#plt.axvline(x=1/7, c='y', linestyle=':')
plt.text(1/29, 35, 'f=1/30')
plt.text(1/250, 35, 'f=1/365')
plt.text(1/6.6, 35, 'f=1/7')
plt.legend()
# plt.xlabel('frequency')

plt.ylabel('power spectral density (PSD) , scaling=density')
plt.title('Periodogram with raw SOI data and logarithmized SOI data')

plt.subplot(2, 1, 2)
f, Pxx_den = signal.periodogram(np.log(df['IAS_brut']), scaling='density')
plt.plot(f, Pxx_den)
# This is just a thin wrapper around plot which additionally changes the y-axis to log scaling.
plt.semilogy(f, Pxx_den)
# https://matplotlib.org/3.1.1/api/_as_gen/matplotlib.pyplot.semilogy.html
plt.ylim(10e-5,)
plt.xlabel('frequency [1/n_jour]')
plt.ylabel('power spectral density (PSD) ')
plt.show()
